
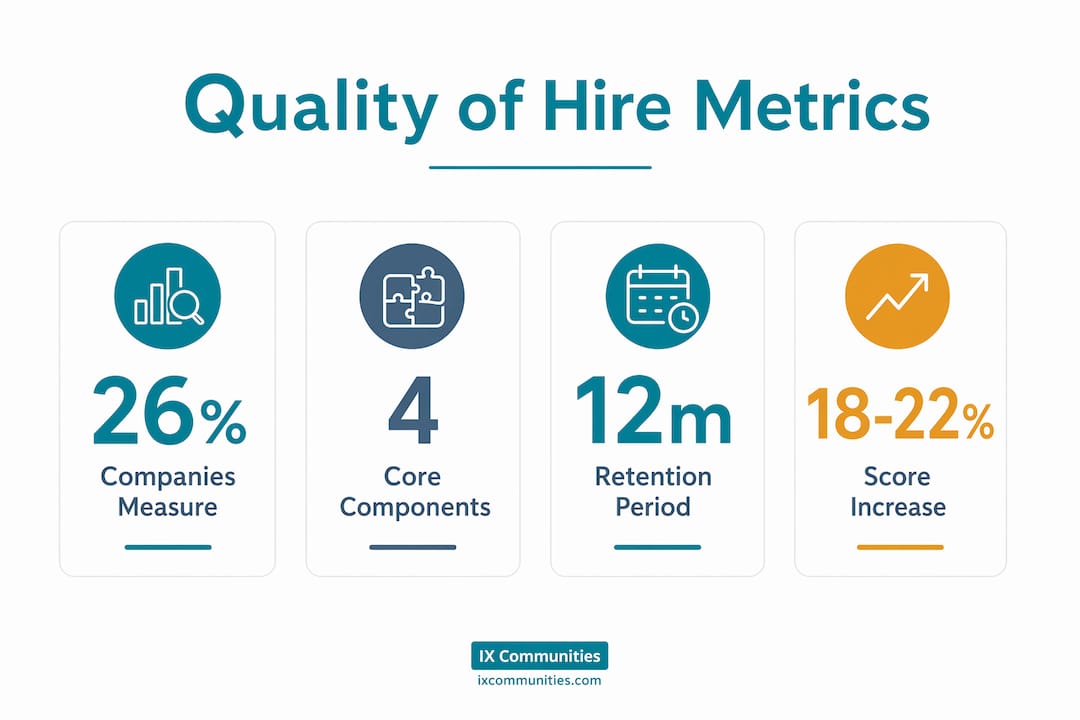
Quality of Hire (QoH) is defined as the measured value and impact a new employee delivers to an organization after joining. It is the most important recruiting metric in talent acquisition, yet only 26% of companies measure it consistently. QoH is not a single number. It is a composite of performance ratings, hiring manager satisfaction, 12-month retention, and time to productivity. Companies using structured interviews achieve 18–22% higher QoH scores than those using unstructured interviews. For Fortune 500 firms, a one-point increase in a standardized QoH Index correlates with approximately $1.9 million in additional annual revenue. The stakes are real. The measurement gap is just as real.
What are the core components used to measure quality of hire?
The composite QoH score is the most widely adopted measurement method in large organizations. It normalizes multiple indicators to a 0–100 scale and averages them into a single score. The industry average composite score sits at 72 out of 100. That number gives TA leaders a baseline, but the components behind it matter far more than the headline figure.
The four core components are performance ratings, hiring manager satisfaction, retention at 12 months, and time to productivity. Each captures a different dimension of hire quality. Performance ratings reflect output. Manager satisfaction captures fit and working relationship. Retention signals whether the hire was sustainable. Time to productivity measures how quickly the new employee reached full contribution.

A standard composite formula works like this: add the normalized scores for each component, then divide by the number of components. For example, if a hire scores 80 on performance, 75 on manager satisfaction, 90 on retention, and 65 on ramp time, the composite QoH score is 77.5. Organizations then track these scores by role, department, source, and recruiter to identify patterns.
| Component | Description | Typical time frame | Average score |
|---|---|---|---|
| Performance rating | Manager-assessed output vs. expectations | 6–12 months post-hire | 74/100 |
| Manager satisfaction | Hiring manager rating of hire quality | 90 days post-hire | 71/100 |
| Retention | Whether the hire remains employed | 12 months post-hire | 78/100 |
| Time to productivity | Days to reach full role contribution | 30–90 days post-hire | 68/100 |
Time to productivity consistently scores lowest across industries. That gap signals a systemic onboarding problem, not a recruiting problem. TA leaders who conflate the two end up solving the wrong issue.
Why is quality of hire so difficult to measure accurately?
The measurement challenge is structural, not motivational. Most TA teams want to track QoH. The systems they work with make it genuinely hard.
The first barrier is data silos. Applicant tracking systems (ATS), human resource information systems (HRIS), and performance management platforms rarely share data automatically. A recruiter who wants to connect a hire's source to their 12-month performance rating often has to pull data from three separate systems and reconcile it manually. That process introduces errors and discourages consistent measurement.
The second barrier is the lagging nature of traditional QoH metrics. Lagging indicators arrive too late to change recruiting behavior. A 90-day survey or annual review tells you what happened. It does not tell you what to do differently on the next search. By the time the data arrives, the recruiter has already closed ten more roles.
The third barrier is subjectivity. Hiring manager satisfaction scores vary widely without calibration. One manager rates every hire a 9 out of 10. Another rates the same quality hire a 6. Without a shared rubric, the data is not comparable across departments.
- Data silos across ATS, HRIS, and performance tools prevent automatic data flow and force manual aggregation.
- Feedback delays from 90-day surveys and annual reviews create a loop-length problem that prevents real-time behavior change.
- Uncalibrated manager ratings introduce subjectivity that makes cross-department comparisons unreliable.
- Metrics sprawl occurs when composite formulas grow beyond six components, making them complex and non-actionable.
- Ownership conflicts between TA, HR, and department leadership create gaps in who collects, owns, and acts on QoH data.
Pro Tip: Limit your composite QoH formula to 4–6 core indicators normalized to a 1–100 scale. More components add complexity without adding clarity, and metrics sprawl is one of the primary reasons QoH programs stall.
How can TA teams shift from lagging to leading indicators?
Leading indicators are signals captured during the hiring process itself, before a candidate starts. They include competency capture scores from structured interviews, rubric variance across interviewers, and decision defensibility ratings. These signals are noisier than post-hire data, but they are actionable within 24 hours. That speed is the point.
The contrast with lagging indicators is stark. A 12-month retention figure tells you the outcome. A rubric variance score from the interview panel tells you whether your interviewers agreed on what they were evaluating. High variance predicts poor hire quality before the offer is made. That is the kind of signal that changes behavior in the current quarter, not the next fiscal year.
- Define role criteria before the search opens. Align hiring managers and recruiters on the competencies, experience levels, and performance expectations for the role. Ambiguity at this stage produces inconsistent evaluations downstream.
- Use structured interviews with standardized questions and scorecards. Structured interviews produce consistent data that can be compared across candidates and tracked over time.
- Track rubric variance across interviewers. When two interviewers score the same candidate 40 points apart on the same competency, that signals a calibration problem, not a candidate problem.
- Score decision defensibility after each debrief. Ask interviewers to rate how confident they are in the hiring decision. Low confidence scores predict higher early attrition.
- Implement a 24-hour post-interview review process. Collect structured feedback immediately after interviews while recall is high. Delayed feedback degrades data quality and reduces the signal value of leading indicators.
Pro Tip: Assign one person to own the post-interview data collection process for each role. Shared ownership of this step typically means no one does it consistently, which eliminates the leading indicator advantage entirely.
The SIOP framework for measuring hire quality recommends a multi-metric longitudinal approach that captures both short-term and long-term outcomes. Leading indicators address the short-term gap. They give TA teams a quality signal while the long-term data is still accumulating.
What strategies improve quality of hire outcomes over time?
Sustained QoH improvement requires process changes across recruiting, onboarding, and cross-functional collaboration. No single intervention produces lasting results.
- Implement structured 90-day onboarding programs with defined milestones. Organizations with structured onboarding achieve 25% higher retention and 30% faster ramp time compared to ad hoc approaches. Those numbers directly improve two of the four core QoH components.
- Run hiring manager satisfaction surveys at 30, 60, and 90 days. Early data points catch problems before they become attrition events. A 30-day satisfaction score below 70 is a reliable early warning signal.
- Integrate ATS, HRIS, and performance management data into a single reporting view. Manual aggregation is the enemy of consistent measurement. Even a basic integration that auto-populates a shared dashboard reduces reporting time and improves data accuracy.
- Treat QoH as a joint business metric, not a recruiting metric. Firms with joint ownership involving TA, HR, and department leadership see stronger correlations between QoH scores and revenue growth. Recruiting alone cannot move this metric.
- Benchmark against industry peers regularly. Internal trends tell you whether you are improving. External benchmarks tell you whether your improvement is fast enough. The 2025 SHRM Benchmarking Report sets average time-to-fill at 44 days and average cost-per-hire at $4,700. QoH benchmarks should sit alongside those figures in every TA dashboard.
- Invest in recruiter training and peer mentorship. Recruiters who understand how their sourcing and screening decisions affect downstream QoH scores make better decisions. Training closes that feedback loop faster than data alone.
Assessing recruitment effectiveness requires pairing efficiency metrics like time-to-fill with outcome metrics like QoH. Neither metric alone tells the full story. A fast hire with a low QoH score is not a success. A slow hire with a high QoH score may still be worth the wait.
Key Takeaways
Quality of Hire is a composite metric that requires structured processes, integrated data, and joint ownership across TA, HR, and department leadership to produce reliable, actionable results.
| Point | Details |
|---|---|
| QoH is a composite metric | Combine performance, manager satisfaction, retention, and ramp time into a normalized 0–100 score. |
| Lagging indicators arrive too late | Shift to leading indicators like rubric variance and competency scores for same-quarter feedback. |
| Limit composite to 4–6 components | More indicators create metrics sprawl and reduce the formula's practical usefulness. |
| Structured onboarding lifts two components | 90-day programs with milestones improve both retention rates and time-to-productivity scores directly. |
| Joint ownership drives business impact | QoH tied to revenue growth requires TA, HR, and department leaders to share accountability for the metric. |
Why QoH measurement is worth the difficulty
The frustration TA leaders feel around QoH measurement is legitimate. The data arrives late. The systems do not talk to each other. Hiring managers rate candidates inconsistently. And when you finally produce a composite score, someone in the room questions whether the formula is right.
I have seen TA teams abandon QoH programs entirely because the measurement felt too imprecise to be useful. That is the wrong conclusion. The right conclusion is that imprecise QoH data is still more useful than no QoH data. A composite score of 72 that you can trend over 12 months tells you far more than a time-to-fill dashboard that never touches outcomes.
The shift that actually moves the needle is treating leading indicators as a parallel track, not a replacement for traditional QoH measurement. Run both. Use rubric variance and decision defensibility scores to adjust behavior in the current quarter. Use 12-month retention and performance ratings to validate whether those adjustments worked. That dual-track approach is what separates TA functions that improve year over year from those that report the same metrics without changing outcomes.
The teams I have seen do this well share one common trait. They stopped treating QoH as a recruiting metric and started treating it as a business metric. That shift in framing changes who owns the data, who acts on it, and how seriously leadership takes the results. Balancing efficiency with quality is not a compromise. It is the actual job.
— Simon
How Ixcommunities supports TA leaders on quality of hire
Ixcommunities provides talent acquisition leaders with the peer networks, benchmarking data, and structured programs needed to move QoH from a theoretical metric to a measured business outcome.

The ESIX Recruiter Peer Mentorship Program connects recruiters with peers who have solved the same measurement challenges in large corporate environments. The Talent Leaders Peer Mentoring Program gives TA executives a structured forum to align on QoH frameworks, share composite scoring approaches, and benchmark outcomes against peer organizations. Ixcommunities Benchmark Surveys provide industry-level data that TA leaders can use to contextualize their internal QoH scores and set credible targets for leadership.
FAQ
What is Quality of Hire and how is it calculated?
Quality of Hire is a composite metric that measures the value a new employee delivers post-hire. It is calculated by normalizing performance ratings, hiring manager satisfaction, retention, and time to productivity to a 0–100 scale and averaging the results.
How many companies consistently measure Quality of Hire?
Only 26% of companies measure QoH consistently, making it one of the most cited yet least tracked metrics in talent acquisition.
What is the difference between leading and lagging QoH indicators?
Lagging indicators like 12-month retention confirm outcomes after the fact. Leading indicators like rubric variance and competency scores during interviews provide feedback within 24 hours and enable real-time behavior change.
How does structured interviewing affect Quality of Hire scores?
Companies using structured interviews with standardized questions and scorecards achieve 18–22% higher QoH scores than those using unstructured interviews.
Who should own Quality of Hire measurement in a large organization?
QoH ownership should be shared across TA, HR, and department leadership. Firms that treat QoH as a joint business metric see stronger correlations between their scores and revenue growth than those where recruiting owns it alone.