
Most talent acquisition teams track metrics. Few track the right ones. The challenge with measuring talent acquisition performance is that activity data is abundant and easy to pull, while the outcome data that actually connects to business results takes more work to collect and interpret. High-performing TA teams measure success differently from the rest, anchoring their dashboards to outcomes rather than outputs. This article outlines the specific frameworks, metrics, and governance routines that separate teams that demonstrate real business impact from those that report on volume and call it a win.
Table of Contents
- Key takeaways
- How high-performing TA teams measure success differently
- Quality of hire: the anchor metric
- Funnel health and predictive indicators
- Governance and measurement cadence
- Practical steps for implementing outcome-based measurement
- A perspective on measurement and what most teams get wrong
- How Ixcommunities supports TA leaders in mastering measurement
- FAQ
Key takeaways
| Point | Details |
|---|---|
| Outcome metrics over activity metrics | High-performing teams prioritize quality of hire and retention over CVs reviewed or messages sent. |
| Quality of hire as the anchor metric | Composite scores using performance, retention, and manager satisfaction give a fuller picture of recruiting effectiveness. |
| Funnel health reveals hidden problems | Tracking application completion and conversion rates by stage exposes friction points before they damage hiring results. |
| Governance cadence matters | Reviewing operational metrics weekly and strategic KPIs monthly or quarterly keeps measurement connected to business decisions. |
| Standardize before you benchmark | Normalizing quality of hire scores onto a 0 to 100 scale is required before comparing results across roles or teams. |
How high-performing TA teams measure success differently
The most common version of a TA dashboard in a large corporation includes time-to-fill, number of requisitions opened, and perhaps cost-per-hire. These are not useless numbers, but they are incomplete. Activity metrics create a false sense of efficiency while hiding the quality problems that only surface after someone is hired.
Consider the scenario where a team reduces average time-to-fill from 45 days to 30 days. That looks like progress. But if the faster fills produce higher 90-day turnover or lower first-year performance ratings, the organization is paying a hidden cost the dashboard never surfaces. High-performing TA teams prioritize outcome and quality metrics over activity-only metrics because activity data tells you what happened, while outcome data tells you whether it mattered.
There is also a sourcing dimension that gets lost in activity-focused measurement. When a team tracks volume by channel but not quality by channel, it cannot make informed decisions about where to invest recruiting resources. Outcome-driven TA leaders connect source data to post-hire performance, not just hire counts.
The metrics that distinguish high-performing teams include:
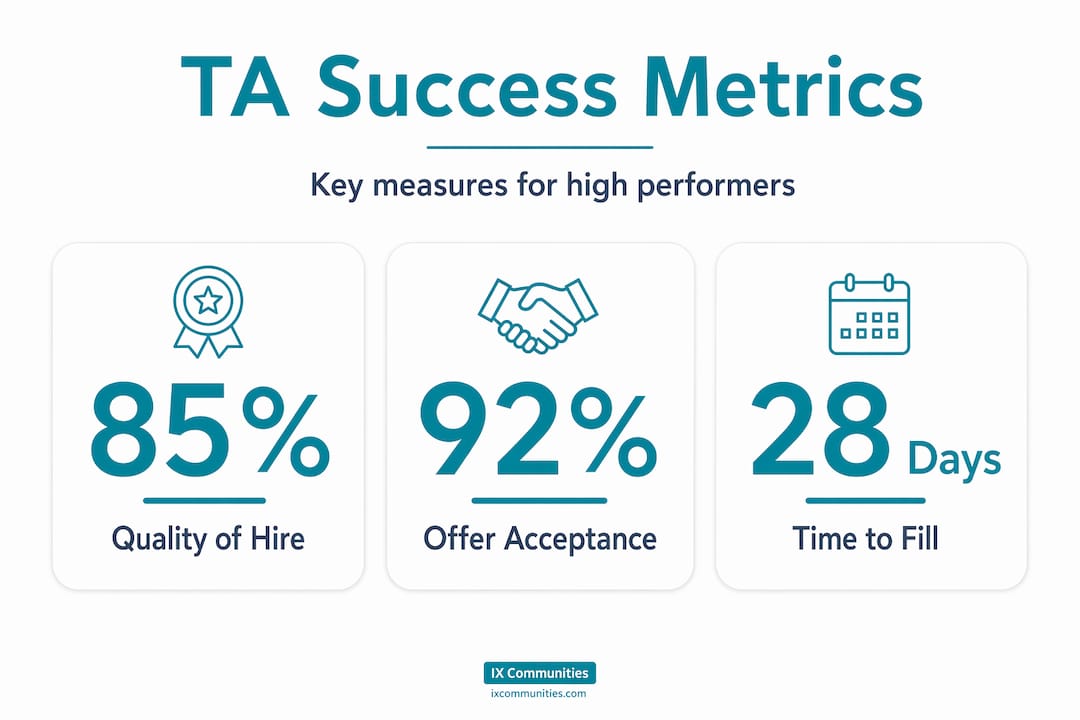
- Quality of hire: A composite score covering performance, retention, manager satisfaction, and time-to-productivity
- Offer acceptance rate: A direct signal of candidate experience and employer brand strength
- First-year retention: Measures whether the hire was a genuine fit, not just a filled seat
- 90-day performance ratings: An early indicator of whether assessments during the process predicted actual job performance
- Hiring manager satisfaction scores: Collected post-hire to evaluate the partnership between TA and the business
Pro Tip: Map each metric on your dashboard to a specific business decision. If you cannot articulate what action a metric informs, it does not belong in your reporting cadence.
Quality of hire: the anchor metric
Of all the KPIs for recruiting success, quality of hire is the one that requires the most discipline to define and measure well. Most teams calculate quality of hire inconsistently, making benchmarking across roles and business units meaningless. The fix is to normalize all components onto a common scale before weighting and averaging.
A practical quality of hire framework includes five components:
- Job performance score at 90 days (from manager review)
- Retention status at 12 months (binary: retained or not)
- Manager satisfaction rating collected 60 to 90 days post-start
- Time-to-productivity measured against a role-specific benchmark
- Cultural fit assessment gathered from peer or manager feedback at 90 days
Once you have scores for each component, normalize scores onto a 0 to 100 scale before calculating a weighted composite. Without normalization, a 4.2 out of 5 manager satisfaction score and a 78% retention figure are mathematically incompatible.
Here is an example of how weighting might look for a mid-level professional role:
| Component | Weight | Example Score (0-100) | Weighted Contribution |
|---|---|---|---|
| Job performance at 90 days | 35% | 82 | 28.7 |
| 12-month retention | 25% | 100 | 25.0 |
| Manager satisfaction | 20% | 76 | 15.2 |
| Time-to-productivity | 10% | 68 | 6.8 |
| Cultural fit | 10% | 84 | 8.4 |
| Quality of hire score | 84.1 |
Timing matters significantly in this framework. Post-hire performance and retention should be measured at both 90 days and 12 months to capture early performance and long-term fit. A new hire who performs well at 90 days but leaves at nine months tells a different story than one who struggles early but becomes a top performer by month twelve.
Quality of hire data also informs sourcing and budget decisions directly. If one sourcing channel consistently produces hires scoring above 80 on your composite while another channel produces scores in the low 60s, the allocation decision becomes straightforward.
Pro Tip: Do not wait for annual performance cycles to collect quality of hire inputs. Build a lightweight 90-day check-in process with hiring managers specifically for TA measurement purposes. You will get more honest and timely data than from formal HR review cycles.
Funnel health and predictive indicators
Funnel health is where TA teams find their leading indicators. While quality of hire is a lagging measure that tells you how the process performed, funnel metrics provide real-time signals about where the process is breaking down.

The distinction between funnel volume and funnel health is worth stating clearly. Volume metrics count activity: applications received, phone screens completed, interviews scheduled. Health metrics measure conversion and completion: what percentage of applicants complete the application, what percentage of phone screens advance to interviews, where candidates drop out and why.
Top-performing talent acquisition teams are 23% more likely to measure application completion rates, which reveal friction in early funnel stages that volume metrics cannot detect. A high application volume with a low completion rate means your process is creating unnecessary barriers that filter out qualified candidates before you ever see them.
Key funnel health metrics to track include:
- Application completion rate: The percentage of started applications that are submitted, with drop-off points identified
- Stage-to-stage conversion rates: How effectively the process advances candidates from one step to the next
- Time-in-stage: How long candidates wait at each stage, which surfaces scheduling inefficiencies and bottlenecks
- Candidate drop-out by stage: Combined with exit survey data to identify experience problems before they compound
- Offer decline reasons: Categorized data that reveals compensation gaps, process friction, or competing offer patterns
Funnel data also enables proactive recruiting interventions. When conversion from phone screen to first interview drops below your historical baseline, that is an early signal worth investigating before it affects time-to-fill. A root cause might be a misaligned job description, a changed screening script, or a sourcing channel shift that is delivering lower-fit candidates.
Leading and lagging indicators together provide both early warning and confirmation of recruiting effectiveness. Funnel health gives you the early warning. Quality of hire gives you the confirmation.
Governance and measurement cadence
Measurement without governance is just data collection. What separates effective TA team strategies from well-intentioned but scattered efforts is a defined cadence for reviewing metrics and clear ownership of each KPI.
Recruiting KPI playbooks recommend reviewing operational metrics weekly and strategic quality metrics monthly or quarterly. In practice, that means:
- Weekly operational reviews cover pipeline volume by role, velocity through funnel stages, and any bottlenecks that need immediate attention
- Monthly strategic reviews examine quality of hire scores, offer acceptance trends, and source-to-quality ratios across active hiring channels
- Quarterly business reviews connect TA performance to workforce planning, turnover costs, and departmental hiring outcomes
Defining KPI intent before publishing a dashboard is a discipline that most large TA organizations skip. Each KPI should map to a business decision or outcome. Time-to-fill, for example, should be linked to a vacancy cost calculation so leadership understands the dollar value of reducing it by ten days. Without that context, it is just a number.
Metric gaming is a real risk in large teams. If recruiters are evaluated primarily on speed, they will optimize for speed. If quality metrics are included in performance evaluation, the incentive structure changes. Measuring recruiter performance on hires or speed alone leads to poorer quality outcomes. Effective governance balances speed, quality, and candidate experience indicators so no single dimension can be optimized at the expense of others.
You can benchmark your current governance practices against peers with data-driven TA benchmarking resources that show how leading corporate teams structure their review routines.
Pro Tip: Assign one named owner to each KPI who is responsible for monitoring it, flagging anomalies, and presenting findings at the relevant review cadence. Shared ownership of metrics produces no ownership in practice.
Practical steps for implementing outcome-based measurement
Shifting from activity to outcome measurement in a large organization is a process, not a single decision. Here are the steps that produce durable results:
-
Start with three to five metrics linked to business decisions. Avoid the temptation to track everything at once. Select the metrics that directly inform budget, headcount planning, or sourcing strategy for your organization specifically.
-
Standardize definitions across all data sources. Before pulling data from your ATS, HRIS, and performance management system, document exactly how each metric is defined. "Time-to-fill" means different things depending on whether the clock starts at requisition approval or job posting. Align definitions first.
-
Integrate ATS, HRIS, and performance data. Quality of hire cannot be calculated from ATS data alone. Build the integration between your recruiting system and the systems that hold post-hire performance and retention data, even if the initial version is a manual data join.
-
Use cohort and root cause analysis. Cohort analysis and root cause reviews uncover hidden process failures not visible in aggregate metrics. Compare quality of hire scores for hires from the same quarter, same sourcing channel, or same hiring manager to find patterns that averages obscure.
-
Communicate impact to leadership using financial language. Translate recruiting metrics into business outcomes. A quality of hire score improvement from 72 to 84 across a 200-person hiring cohort has a calculable impact on productivity and retention cost. Quantify it and present it in terms your CFO and business leaders understand.
Explore executive recruiting metrics that connect TA performance directly to business outcomes for additional frameworks you can adapt to your reporting structure.
A perspective on measurement and what most teams get wrong
I have observed a consistent pattern across large TA organizations: teams invest significant time building dashboards that report on what is easy to count rather than what is hard to measure but actually matters. The metrics that require integrating systems, following up with hiring managers, and waiting twelve months for retention data are the ones that get deprioritized because they demand more work.
The result is a measurement infrastructure that looks thorough but produces decisions grounded in incomplete information. Speed and volume get optimized. Quality gets discussed in theory but rarely tracked in practice.
What I have found is that quality of hire, measured with consistency and discipline, changes how TA leaders talk to business partners. When you can show a hiring manager that the last six hires from a specific sourcing channel scored an average of 88 on your quality composite while hires from a different channel averaged 61, the conversation about where to invest recruiting resources becomes concrete and defensible.
The governance piece is equally underestimated. Without a defined cadence, even good metrics decay into ignored dashboards. The teams that sustain measurement improvement over time are the ones that build review routines into the operating rhythm of the function, not as a reporting exercise but as a decision-making habit.
The shift from activity to outcome measurement is not technically complex. It is organizationally demanding. It requires alignment between TA, HR systems, and business leaders. That alignment is where the real work happens, and where the real competitive advantage is built.
— Simon
How Ixcommunities supports TA leaders in mastering measurement
Ixcommunities, through ESIX, TLIX, and the broader IXCommunities network, provides talent acquisition leaders in large corporations with the peer resources, benchmarking data, and professional development programs needed to build outcome-focused measurement practices. The ESIX Recruiter Peer Mentorship Programs connect TA professionals with experienced peers who have navigated the shift from activity metrics to quality-of-hire frameworks in complex enterprise environments. For teams looking to compare their KPI structures against industry peers, Benchmark Surveys offer data-driven context that makes internal measurement decisions more defensible. IX Communities Membership provides ongoing access to training, networking, and resources within a secure environment designed specifically for corporate talent leaders.
FAQ
What metrics do high-performing TA teams track?
High-performing TA teams track outcome metrics including quality of hire, first-year retention, offer acceptance rate, and 90-day performance scores. They move beyond activity metrics like time-to-fill and application volume.
How is quality of hire calculated?
Quality of hire is calculated as a weighted composite of normalized scores for job performance, retention, manager satisfaction, time-to-productivity, and cultural fit. Scores are normalized onto a 0 to 100 scale before weighting to allow valid comparison across roles.
How often should TA teams review their KPIs?
Operational funnel metrics should be reviewed weekly while strategic KPIs such as quality of hire and cost-per-hire are best reviewed monthly or quarterly to align with business planning cycles.
What is the difference between funnel volume and funnel health?
Funnel volume measures total activity counts such as applications received or interviews scheduled. Funnel health measures conversion rates and drop-off points at each stage, which reveals where the process creates friction or loses qualified candidates.
How do you prevent metric gaming in large TA teams?
Prevent metric gaming by including both speed and quality measures in recruiter performance evaluation. Measuring recruiters on speed or hires alone produces poor quality outcomes. Balanced scorecards that include conversion rates, quality of hire, and candidate experience scores reduce single-dimension optimization.