

Diversity benchmarking converts DEI commitments into measurable, defensible, and repeatable accountability — and that is why HR and talent leaders treat it as a core management discipline, not an optional reporting exercise. Without a structured benchmark, organizations cannot distinguish genuine progress from favorable optics, cannot satisfy ESG and investor expectations for methodology transparency, and cannot locate the specific process failures — in hiring, promotion, or pay — that block underrepresented groups from advancing.
Three immediate payoffs for talent leaders:
- Accountability: Benchmarked targets give managers and executives a measurable standard, not a vague aspiration.
- Investor and ESG credibility: External stakeholders increasingly require disclosed methodology and peer-comparable data, not narrative claims.
- Diagnostic precision: Systematic measurement surfaces where systemic barriers actually sit — sourcing funnels, promotion panels, or compensation bands — rather than where leaders assume they sit.
Peer benchmarking communities such as Ixcommunities give diversity recruiting leaders access to cohort-based comparisons in a confidential environment, which is the kind of structured peer context that makes benchmark data credible and actionable.
Key Takeaways
Diversity benchmarking is the accountability mechanism that converts DEI commitments into measurable progress — without it, organizations cannot distinguish genuine advancement from favorable optics or defend program investment to boards and investors.
| Point | Details |
|---|---|
| Benchmarking vs. one-off metrics | Benchmarks track progress over time against peers; single snapshots provide status without trend or context. |
| Core metrics to prioritize | Measure across the full lifecycle: hiring funnel, promotion rates, adjusted pay gap, attrition, and inclusion scores. |
| Five-step process | Define scope, select peers, collect and clean data, analyze with controls, then set targets with named executive owners. |
| Governance requirement | Quarterly monitoring and annual board reporting, with at least one benchmarked KPI linked to executive incentives. |
| Ixcommunities benchmark surveys | Provide cohort-based, confidential peer benchmarking matched by industry and role mix, with sample reports available. |
Table of Contents
- Why diversity benchmarking differs from one-off metrics
- Practical benefits of benchmarking for talent strategy and the business
- Core metrics every diversity benchmark should include
- How to run a DEI benchmark: a practical five-step process
- Choosing peers and credible data sources
- How to interpret benchmark outputs and turn them into action plans
- Common pitfalls in DEI benchmarking and how to avoid them
- Governance model, reporting cadence, and investor expectations
- What credible benchmarking methodology looks like
- Five research-backed measurement considerations every HR leader must include
- The case for prioritizing measurement: a practitioner perspective
- Ixcommunities benchmark surveys: what talent leaders can expect
- Sources
Why diversity benchmarking differs from one-off metrics
DEI benchmarking is systematic, repeatable measurement of workforce diversity and inclusion outcomes against a defined reference point: a peer group, an internal historical baseline, or an industry standard. The key word is repeatable. A one-off metric tells you where you are today. A benchmark tells you whether you are moving, how fast, and relative to whom.
The distinction matters because single snapshots are easy to misread. Context and trend are what give a number meaning.
| Dimension | One-off metric | DEI benchmark |
|---|---|---|
| Purpose | Status check | Progress and peer comparison |
| Scope | Single measure, single point in time | Multiple metrics across the employee lifecycle |
| Frequency | Ad hoc | Quarterly monitoring, annual reporting |
| Best use case | Internal reporting, quick audits | Governance, investor disclosure, program evaluation |
Public rankings and ratings occupy a third category. They aggregate scores across many organizations and produce a league-table position, which is useful for employer brand but too coarse for operational decisions. A benchmark built on your own data, cleaned and compared against a well-matched peer group, gives you the granularity to act.
Key characteristics of a credible DEI benchmark:
- Defined peer group with documented selection criteria
- Consistent metric definitions applied across periods
- Segmentation by level, function, and geography
- Linkage across lifecycle stages (hiring through attrition)
- Statistical adjustments for structural differences between organizations
Practical benefits of benchmarking for talent strategy and the business
The most direct benefit is accountability. When representation targets are benchmarked against peers and tied to manager scorecards, DEI goals shift from aspirational language to performance criteria. Leaders can point to a number, explain the gap, and report on the intervention.
Benchmarking also connects DEI to business outcomes in a way that satisfies finance and the board. MIT Sloan research documents that organizations frequently fail to translate DEI commitments into measurable actions because they lack clarity on what to measure and how to interpret it — a gap that benchmarking directly addresses by providing a structured measurement framework.
Concrete benefits for HR and talent leaders:
- Risk management and regulatory readiness: Pay equity and representation data collected for benchmarking purposes also prepares organizations for mandatory disclosure requirements and regulatory audits.
- Employer brand and talent attraction: Candidates increasingly evaluate employers on published DEI data. A credible benchmark gives recruiting teams verified figures to share, not marketing copy.
- Defending DEI spend during downturns: Programs backed by benchmarked outcome data are far harder to cut than programs backed by sentiment surveys. When a benchmark shows a measurable promotion-rate gap closing over two years, that is a business case, not a diversity initiative.
- ESG and investor alignment: Institutional investors and ESG rating agencies now expect disclosed methodology, peer-comparable metrics, and longitudinal data. Participating in credible DEI benchmarks prepares organizations for that scrutiny.
Consider a talent team that used annual benchmark data to show a 12-point gap between their internal promotion rate for women in technical roles and the peer-group median. That single finding redirected budget from a general awareness program to a targeted sponsorship initiative, with a measurable 18-month target. The benchmark did not simply describe a problem — it justified a program pivot to the CFO.
Core metrics every diversity benchmark should include
Metrics organized by lifecycle stage give a benchmark its diagnostic power. Representation counts alone tell you the outcome; lifecycle metrics tell you where the pipeline breaks.
Attraction and hiring
- Diverse applicant ratio by job family and level
- Interview pass-through rate by demographic group
- Offer acceptance rate by demographic group
- Sourcing channel diversity (which channels produce diverse slates)
Advancement and promotion
- Promotion rate by demographic group and level band
- Time-to-promotion by group
- High-potential program participation rates
Pay and compensation
- Unadjusted gender and race/ethnicity pay gap
- Adjusted pay gap (controlling for role, level, tenure, and geography)
- Bonus and equity award distribution by group
Retention and attrition
- Voluntary attrition rate by demographic group and level
- Regrettable attrition rate by group
- Exit interview themes by group
Inclusion and experience
- Inclusion index scores from employee surveys (belonging, psychological safety, fairness)
- Manager effectiveness ratings by demographic group of direct reports
Representation by level and function
- Headcount share by demographic group at each level (individual contributor through C-suite)
- Board and executive team composition
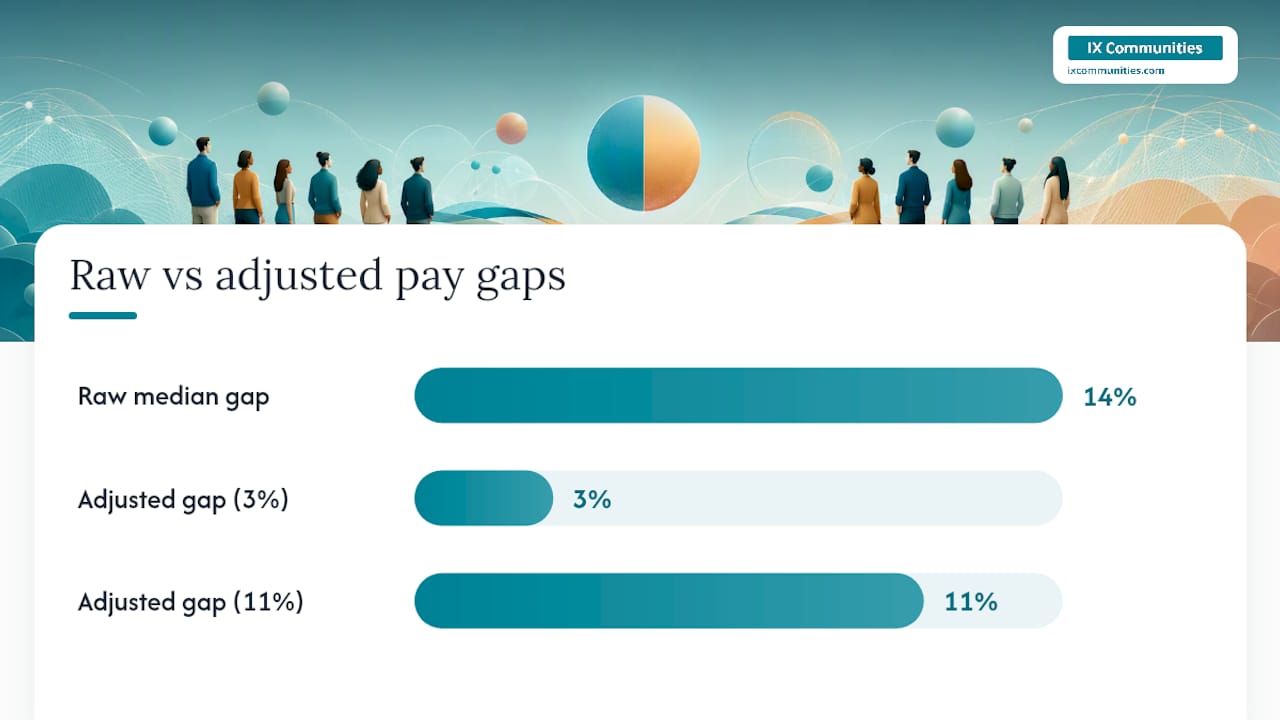
Worked example: adjusted pay gap calculation. Take the raw median pay gap between men and women in a job family. Then run a regression controlling for level, tenure, performance rating, and location. The residual gap after those controls is the adjusted pay gap — the portion not explained by structural factors. A raw gap of 14% that adjusts to 3% after controls tells a very different story than one that adjusts to 11%. Both figures belong in the benchmark report, with the methodology disclosed.
Pro Tip: Segment every metric by at least two dimensions simultaneously — for example, gender within each level band, not just gender overall. Intersectional gaps (women of color at the director level, for instance) are routinely invisible in aggregate figures and are often where the largest disparities sit.
The APQC benchmarking resource collection provides sample metric frameworks that organizations can adapt when building their initial metric set.
How to run a DEI benchmark: a practical five-step process
A well-run benchmark follows a defined sequence. Skipping steps — particularly peer selection and data cleaning — is the most common reason benchmark outputs fail to hold up under board or investor scrutiny.

Step 1: Define objectives and scope. Decide what decisions the benchmark will inform. Is the primary use case pay equity disclosure, promotion parity, or hiring funnel analysis? Scope determines which metrics to collect and which peer group is relevant. Document the objective before touching data.
Step 2: Select peers and benchmark type. Choose between internal benchmarking (comparing business units or geographies against each other), external industry benchmarking (comparing against sector peers), and occupational benchmarking (comparing against labor market availability by role). Most organizations need all three at different points. For step-by-step recruiting benchmark guidance, peer selection criteria should include industry, company size, geography, and role mix.
Step 3: Collect and clean data. Pull data from HRIS, payroll, ATS, and survey systems. Standardize demographic categories, resolve missing data, and document every cleaning decision. Undocumented cleaning choices undermine credibility when methodology is disclosed.
Step 4: Analyze and adjust for comparability. Apply statistical controls where needed (pay gap analysis, promotion rate normalization). Flag results with small sample sizes — typically fewer than 30 in a subgroup — as directional only, not statistically reliable. Use trend lines across at least two periods before drawing conclusions.
Step 5: Set targets and embed into governance. Translate benchmark gaps into specific, time-bound targets. Assign an executive owner for each target. Embed reporting into the quarterly business review cycle and annual board reporting.
Timeline: An initial benchmark typically takes 6–12 weeks from data pull to executive presentation. Quarterly monitoring of leading indicators (hiring funnel, attrition) and an annual comprehensive report is the standard cadence for organizations that have completed their baseline.
Expected deliverables: baseline representation report, adjusted pay-gap analysis, hiring funnel comparison, executive summary with prioritized gaps, and a recommended action plan with named owners and timelines.
Choosing peers and credible data sources
The quality of a benchmark is only as good as the comparability of its reference group. A technology company benchmarking its representation figures against a cross-industry average that includes healthcare and retail will draw misleading conclusions about its own performance.
External data sources available to HR leaders:
- Public sources: Bureau of Labor Statistics (BLS) occupational employment data, OECD workforce statistics, EEOC aggregate data
- Commercial vendors: HR analytics platforms that aggregate anonymized client data by industry and company size
- Industry consortiums: Sector-specific groups that pool anonymized workforce data from member organizations
- Peer networks and benchmark surveys: Confidential peer-cohort surveys through communities such as Ixcommunities, where participants share data under defined confidentiality protocols
- Academic datasets: Published studies and frameworks, including the multi-dimensional measurement framework developed for academic departments, which translates well to corporate settings
Peer selection criteria to apply:
- Industry classification (primary NAICS or SIC code)
- Company size band (headcount and revenue)
- Geographic footprint (domestic vs. multinational)
- Job family mix (a company with 60% engineers needs engineering-specific benchmarks, not general workforce averages)
- Organizational maturity on DEI measurement
Statistical comparability: Before comparing your promotion rate to a peer's, confirm the denominator is defined the same way. Does "eligible for promotion" include employees on leave? Does it require a minimum tenure? Inconsistent denominators produce false gaps.
Pro Tip: Build a cohort-based peer group of 8–15 organizations with similar role mix and geography, then adjust for structural differences (e.g., a peer with a much higher proportion of entry-level roles will naturally show lower overall representation at senior levels). A small, well-matched cohort produces more useful signal than a large, heterogeneous comparison group.
For organizations benchmarking executive talent specifically, portfolio benchmarking approaches for leadership roles provide a useful framework for selecting and comparing senior-level peers.
How to interpret benchmark outputs and turn them into action plans
A benchmark report is not an action plan. It is a diagnostic. The gap between those two things is where most DEI programs stall.
Distinguishing signal from noise. A single-period gap between your promotion rate and the peer median could reflect a real disparity, a data cleaning error, a structural difference in role mix, or random variation in a small sample. Before escalating a finding, apply three tests: Is the gap statistically significant given the sample size? Does it persist across two or more periods? Does it appear in more than one related metric (e.g., both promotion rate and time-to-promotion)?
HBR research on DEI data use documents that misuse of single snapshots — treating a raw count as a conclusion — is one of the most common ways organizations draw misleading inferences from workforce data. Trend analysis and process linkage are the correctives.
Turning a promotion-rate gap into a parity plan:
- Confirm the gap is statistically reliable across at least two periods.
- Identify the stage where the gap originates: nomination rates, panel decisions, or calibration outcomes.
- Assign an executive owner (typically the CHRO or a business unit head) with a 12-month target.
- Define success metrics: promotion rate parity within the target group within two annual cycles.
- Set a quarterly monitoring cadence using leading indicators (nomination rates, calibration participation).
Common metric gaps and typical interventions:
- Hiring funnel drop-off for underrepresented groups at the screening stage: sourcing channel audit, structured interview training, diverse slate requirements
- Promotion rate gap at the manager-to-director transition: sponsorship program, calibration process review, manager accountability metrics
- Adjusted pay gap above 3%: compensation band audit, promotion-linked pay review, equity adjustment budget
- High voluntary attrition among underrepresented senior leaders: stay interviews, career pathing review, inclusion survey follow-up
- Low inclusion index scores in specific business units: manager effectiveness training, team-level action planning, leadership accountability
For practical examples of how benchmark-driven interventions translate into diversity recruiting results, the connection between sourcing changes and representation outcomes is well documented.
Common pitfalls in DEI benchmarking and how to avoid them
Most benchmarking failures are predictable. The following pitfalls account for the majority of programs that produce reports but no change.
- Snapshot thinking: Treating a single benchmark as a conclusion rather than a starting point. Remedy: Commit to at least two measurement periods before drawing trend conclusions. Build longitudinal tracking into the program design from day one.
- Poor peer selection: Comparing against a group that is structurally incomparable (different industry, role mix, or geography). Remedy: Document peer selection criteria explicitly and review the peer group annually as your organization's structure changes.
- Ignoring intersectionality: Reporting aggregate figures that mask compounding disparities (e.g., women of color vs. white women vs. men of color). Remedy: Segment every key metric by at least two demographic dimensions. Flag subgroups below minimum reportable size rather than suppressing them entirely.
- Data quality issues: Inconsistent demographic self-identification rates, mismatched denominators across systems, or undocumented cleaning decisions. Remedy: Establish a data governance protocol before the first benchmark cycle. Document every assumption.
- Misusing small sample results: Reporting a 40% promotion rate for a subgroup of 10 employees as a reliable finding. Remedy: Apply a minimum reportable threshold (typically n=30) and label smaller subgroups as directional only.
- Failing to link data to process change: Collecting metrics without connecting them to the business processes that produce them. This is the core failure mode HBR describes — adding diverse hires without changing promotion, assignment, or performance processes produces no lasting change in representation.
Privacy and legal compliance checklist:
- Collect demographic data with explicit, lawful consent
- Apply anonymization before sharing any data externally
- Restrict access to identifiable data by role (data steward, HR analytics lead)
- Report at the group level only; suppress subgroups below the minimum threshold
- Align data retention and deletion practices with applicable employment law
Pro Tip: Before sharing benchmark data with an external vendor or consortium, confirm the data sharing agreement specifies that your organization's data will not be identifiable in any published output. Confidentiality protocols are a non-negotiable requirement for peer-cohort benchmarks.
Governance model, reporting cadence, and investor expectations
A benchmark without governance is a report that gets filed and forgotten. Embedding benchmarking into the organization's accountability structure is what converts data into sustained change.
Roles and responsibilities:
- Executive sponsor (CEO or CHRO): Owns public commitments and approves targets; receives quarterly summary and annual board report
- DEI lead: Manages the benchmark program, coordinates data collection, and owns the action plan
- HR analytics team: Executes data pulls, cleaning, and statistical analysis; maintains the methodology documentation
- Data steward: Controls access to identifiable data and enforces privacy protocols
- Board or committee liaison: Presents annual results to the board's compensation or governance committee; links executive incentive metrics to benchmark outcomes
Recommended cadence:
- Quarterly: Monitor leading indicators (hiring funnel diversity, attrition by group, promotion nominations). Share with executive team and business unit heads.
- Annually: Publish a comprehensive benchmark report covering all lifecycle metrics. Tie results to executive goal-setting for the following year. Disclose methodology and peer group definition in public ESG or sustainability reporting.
Investor and ESG expectations have shifted from "do you have a DEI program?" to "can you demonstrate progress against a credible external standard?" Institutional investors now routinely request methodology disclosure, peer-comparable data, and evidence of independent validation. Organizations that engage systematically with credible benchmarks are better positioned to respond to those requests without scrambling to assemble data after the fact.
Linking at least one or two benchmarked KPIs to executive compensation is the single governance decision most correlated with sustained measurement discipline. When a metric affects a bonus, it gets tracked.
What credible benchmarking methodology looks like
Stakeholders — boards, investors, and regulators — are increasingly able to distinguish a credible benchmark from a self-reported number dressed up as one. The following checklist covers the methodology elements that raise credibility.
Methodology credibility checklist:
- Transparent survey instruments or data collection protocols, available for review
- Documented peer-definition logic (selection criteria, exclusion rules, annual review process)
- Reported sample sizes for each metric and subgroup
- Documented data cleaning rules (how missing data, outliers, and definitional inconsistencies are handled)
- Statistical adjustments disclosed (control variables used in pay gap analysis, normalization methods for promotion rates)
- Independent review or third-party validation of methodology and outputs
Expected report outputs:
| Report section | What it contains |
|---|---|
| Representation by level | Headcount share by demographic group at each organizational level |
| Hiring funnel metrics | Applicant, interview, offer, and acceptance rates by demographic group |
| Promotion-rate comparison | Internal promotion rates vs. peer-group median, by level and group |
| Adjusted pay-gap results | Raw and adjusted pay gaps with control variables disclosed |
| Inclusion index scores | Survey-based belonging and fairness measures, trended over time |
| Attrition analysis | Voluntary and regrettable attrition by demographic group and level |
Transparency on methodology is not just a credibility signal — it is what allows a board or investor to assess whether the benchmark is measuring what it claims to measure. A report that presents figures without methodology is a marketing document, not a governance tool. The APQC benchmarking resource collection provides sample frameworks that illustrate what methodology-transparent reporting looks like in practice.
Five research-backed measurement considerations every HR leader must include
Good measurement design is what separates a benchmark that holds up under scrutiny from one that produces defensible-looking numbers with no diagnostic value. Five considerations, grounded in published research, define the difference.
-
Hierarchical level segmentation. Aggregate representation figures mask the most important disparities. A company can report 45% women in its workforce while having 12% women at the VP level and above. Segment every metric by organizational level. Implementation tip: Define level bands consistently across business units before the first data pull.
-
Geographic and contextual adjustments. Labor market availability varies significantly by location. A 20% representation figure for a demographic group means something different in a market where that group represents 35% of the qualified labor pool versus 8%. Adjust hiring and representation metrics against local labor market data (BLS occupational data by metro area is a practical starting point). Implementation tip: Build geography as a standard filter in your benchmark dashboard from the outset.
-
Multiple diversity dimensions. Race/ethnicity and gender are the most commonly tracked dimensions, but a complete benchmark also includes disability status, veteran status, and — where legally permissible and self-identification rates are sufficient — age and LGBTQ+ identity. The multi-dimensional measurement framework developed in academic research demonstrates that single-dimension measurement routinely misses the groups with the largest outcome gaps.
-
Linkages across metrics from hiring to retention. A promotion-rate gap does not exist in isolation. It is connected to who gets hired, who gets assigned to high-visibility projects, who receives top performance ratings, and who stays. MIT Sloan's measurement guidance emphasizes time-series tracking and lifecycle linkage as the two most important structural features of a useful DEI measurement program.
-
Time-series tracking. A single benchmark period is a baseline, not a trend. Meaningful accountability requires at least two comparable periods before drawing conclusions, and three or more before claiming a program is working.
Measurement tied to outcomes is what defends DEI programs when budgets tighten. Without longitudinal data showing a metric moving in the right direction, a program is a cost center. With it, the program is an investment with a documented return.
These five considerations also reinforce managerial accountability. When a manager knows that their team's promotion rate by demographic group will be benchmarked against peers and reported to the executive team quarterly, the measurement itself changes behavior — before any intervention is deployed.
The case for prioritizing measurement: a practitioner perspective
The organizations that sustain DEI progress over multiple years share one characteristic: they treat measurement as a management discipline, not a communications function. The benchmark is not the annual diversity report. It is the operational tool that tells leaders whether their programs are working and where to redirect resources.
One practical approach that experienced talent leaders use: publish a short executive dashboard — no more than five metrics — and link manager incentives to two of them. The dashboard creates visibility; the incentive link creates accountability. Neither works without the other, and both require a credible benchmark as the foundation.
Ixcommunities members who participate in peer benchmarking cohorts consistently report that the peer comparison is the most useful element — not because it tells them they are behind, but because it tells them where they are behind and gives them a reference point for what a realistic improvement target looks like. That context is what turns a gap into a plan.
Ixcommunities benchmark surveys: what talent leaders can expect
Talent leaders who want structured, peer-comparable DEI measurement without building a benchmarking program from scratch have a direct option through Ixcommunities.
Ixcommunities benchmark surveys give corporate diversity recruiting and talent acquisition leaders access to cohort-based benchmarking in a confidential peer environment. Participants receive a sample report format before committing, data is handled under strict confidentiality protocols, and peer cohorts are matched by industry, company size, and role mix — the structural comparability that makes benchmark data credible. The Ixcommunities membership also includes access to peer networking, expert speaker sessions, and recruiting best-practice guidebooks, so benchmarking sits within a broader knowledge-sharing context rather than as a standalone data exercise. To see what a benchmark report covers and to connect with a peer cohort matched to your organization's profile, visit the benchmark surveys page and request access.
Sources
- Improve Your Diversity Measurement for Better Outcomes
- The mistake companies make when they use data to plan diversity efforts
- Measuring equity, diversity, and inclusion in academic departments (example framework)
- Why companies should systematically engage with diversity and inclusion benchmarks