

The Recruitment Top 100 is Ixcommunities' ranked benchmarking of the highest-performing in-house talent acquisition teams at mid-to-large U.S. companies, evaluated against verified operational and outcome metrics. It is designed for Heads of Talent Acquisition, Chief People Officers, and heads of executive and diversity recruiting who need an objective external reference point for investment decisions, org design, and performance standards.
- The list ranks in-house TA teams only, not staffing firms or external agencies.
- Rankings draw on SHRM 2026 benchmarking data and APQC Talent Acquisition Key Benchmarks, combined with verified member submissions.
- Ixcommunities publishes the full list annually; teams can view results and submit data through the Benchmark Surveys portal.
Pro Tip: If your team is already tracking time-to-fill and cost-per-hire, you likely have most of the data required to submit. The gap for most teams is quality-of-hire measurement, so start there before the next submission window opens.
Table of Contents
- Who qualifies for the Recruitment Top 100?
- How the Top 100 ranking is built
- How to use the Top 100 benchmarks to prioritize improvements
- How to get your team on the Recruitment Top 100
- What inclusion on the Top 100 means for your team
- Key Takeaways
- Why peer review changes what a ranking can actually tell you
- Ixcommunities membership gives TA leaders direct access to the Top 100 process
- Useful sources
Who qualifies for the Recruitment Top 100?
Eligibility is limited to in-house talent acquisition and corporate recruiting teams operating within mid-to-large U.S.-based companies. Staffing agencies, RPO providers, and third-party search firms are excluded. The ranking covers operational performance across a defined 12-month data window aligned with the current annual cycle.
The scope matters for C-level and Head-of-TA decisions in a specific way. When a CPO is deciding whether to add recruiter headcount, restructure the TA function, or renegotiate technology contracts, peer benchmarks from comparable in-house teams carry more weight than industry-wide averages that include agency data. The Top 100 provides that peer-specific reference.
Eligibility at a glance: In-house TA teams at U.S. companies with 1,000 or more employees, submitting verified data across at least four of the six primary ranking metrics, are eligible for consideration. Teams must be corporate employees, not embedded contractors or outsourced providers.
How the Top 100 ranking is built
The methodology combines three primary data inputs: SHRM 2026 benchmarking (a survey of 4,657 SHRM members, collected November 24, 2025 through January 23, 2026), APQC Open Standards Benchmarking cross-industry medians, and audited ATS/HRIS extracts submitted directly by Ixcommunities member teams.
Primary ranking metrics
| Metric | What it measures | Normalization applied |
|---|---|---|
| Time-to-fill | Calendar days from requisition open to offer accept | Adjusted by role level and industry |
| Cost-per-hire | Total recruiting spend divided by hires | Adjusted by company size band |
| Recruiter requisition load | Open reqs per recruiter FTE | Adjusted by org size tier |
| New-hire retention (90–180 day) | Percentage of hires retained past 90 and 180 days | Adjusted by role category |
| D&I hiring outcomes | Representation metrics against stated hiring targets | Self-reported with documented evidence |
| Offer acceptance rate | Offers extended vs. offers accepted | Unadjusted |
Weighting favors outcome metrics (retention, offer acceptance, D&I outcomes) over pure efficiency metrics, reflecting the quality-of-hire priority that practitioners consistently identify as the most meaningful signal of TA performance. Industry and size normalization uses APQC's cross-industry median values so that a 2,000-person manufacturing company is not scored against the same absolute benchmarks as a 50,000-person financial services firm.
Verification process:
- Teams submit de-identified, aggregated ATS/HRIS extracts rather than manually entered figures, following the approach recommended by APQC's Talent Acquisition and Optimization assessment.
- Ixcommunities conducts a documentation review against submitted metrics.
- A peer panel of Ixcommunities members reviews submissions for plausibility and flags outliers for spot audit.
- Spot audits request source system screenshots or system-generated reports for a random sample of submitted figures.
- All submitted data is held under strict confidentiality. Aggregated, anonymized findings appear in published reports; no team-level data is disclosed without explicit consent.
Data note: Teams that complete the APQC Source, Recruit, and Select rapid assessment before submitting typically require fewer follow-up audit requests, because the assessment output maps directly to the metric definitions used in the ranking.
How to use the Top 100 benchmarks to prioritize improvements
The data points to a clear sequence of interventions, ordered by likely impact relative to implementation effort.
-
Measure quality of hire first. If your team does not formally track 90-day and 180-day retention by recruiter and by role category, that gap should be closed before any other investment. Without it, you cannot evaluate whether any other change is working. The complete recruiting metrics framework provides a practical starting structure.
-
Centralize candidate communications. Unified texting and scheduling platforms reduce time-to-fill and improve candidate experience with relatively low implementation cost. This is the highest-ROI structural change for most mid-size TA teams.
-
Redesign recruiter roles to reduce low-value work. Coordinators should own scheduling and administrative tasks; recruiters should own candidate assessment and hiring manager relationships. High-performance TA team design requires this separation to function.
-
Adopt AI for scheduling and reporting. Automate interview scheduling and pipeline reporting before adding headcount. The data consistently shows this produces better outcomes at lower cost.
-
Formalize TA as a consultative partner. This means requesting business justification for requisitions, challenging roles that lack strategic clarity, and aligning hiring plans with workforce strategy. The shift toward consultative TA is a documented differentiator among top-performing functions, and it requires a deliberate cultural mandate from TA leadership.
Pro Tip: Most TA leaders underinvest in measurement discipline. Tracking time-to-fill and cost-per-hire is table stakes. The teams that consistently appear in top-performer benchmarks are the ones that have formalized quality-of-hire reporting and tied it to business outcomes, not just HR dashboards.
For teams building or maturing an executive recruiting function, the step-by-step guide to building an executive recruiting function provides implementation detail aligned with these priorities.
How to get your team on the Recruitment Top 100
The submission process follows a structured sequence with a defined annual timeline.
- Complete a rapid self-assessment — Use the APQC Source, Recruit, and Select rapid performance assessment to identify gaps before submitting.
| Requirement | Detail |
|---|---|
| Membership | ESIX or Ixcommunities membership required for submission |
| Data format | De-identified ATS/HRIS system extracts preferred |
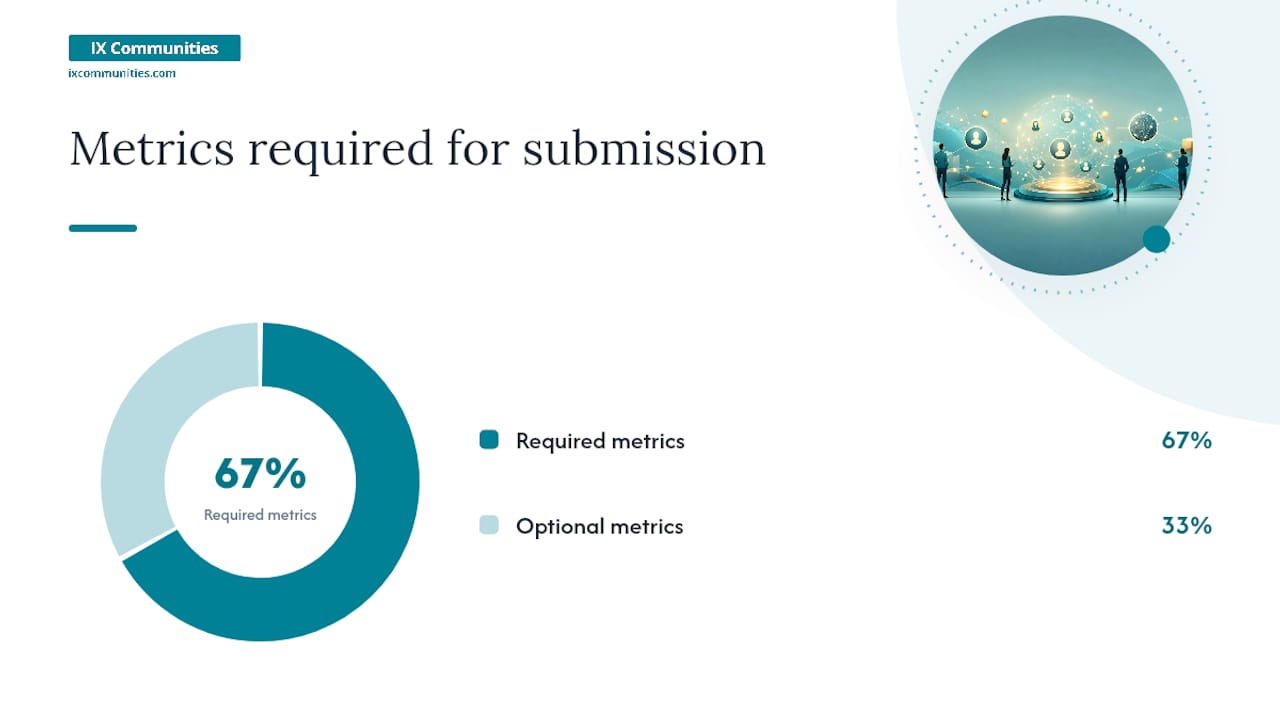
| Minimum metrics | Four of six primary metrics required |
| Confidentiality | Team-level data never published without consent |
| Annual cadence | Submissions open once per year; list updated annually |
All submitted data is governed by Ixcommunities' confidentiality commitments. Aggregated findings appear in published benchmarking reports; individual team data is never disclosed in identifiable form.
What inclusion on the Top 100 means for your team
Recognition on the Recruitment Top 100 carries concrete organizational and functional value.
- Employer brand signal: Inclusion can be referenced in recruiting materials and job postings as a verified indicator of TA quality, which supports candidate attraction in competitive markets. For context on operating in tight candidate markets, recruiting in a candidate-driven market outlines relevant tactics.
On confidentiality: Ixcommunities does not publish team-level metric data. Listed teams are identified by name only if they provide explicit consent. All benchmarking reports use aggregated, anonymized data. Teams that do not consent to public identification still receive the full comparative report and all member benefits.
Key Takeaways
The Recruitment Top 100 is the only U.S. in-house TA ranking that combines SHRM 2026 and APQC benchmarks with peer-audited member submissions across six verified operational and outcome metrics.
| Point | Details |
|---|---|
| Measure quality of hire | Track 90-day and 180-day retention by role category before any other metric investment. |
| Automate before adding headcount | Top teams used AI for analytics and scheduling rather than scaling staff. |
| Formalize consultative TA | Challenge unjustified requisitions and align hiring plans with workforce strategy to reach top-tier performance. |
| Submit verified ATS/HRIS data | De-identified system extracts reduce audit burden and improve ranking accuracy for submitting teams. |
| Ixcommunities membership | ESIX and Ixcommunities members access benchmarking reports, peer roundtables, and mentorship programs tied to the Top 100. |
Why peer review changes what a ranking can actually tell you
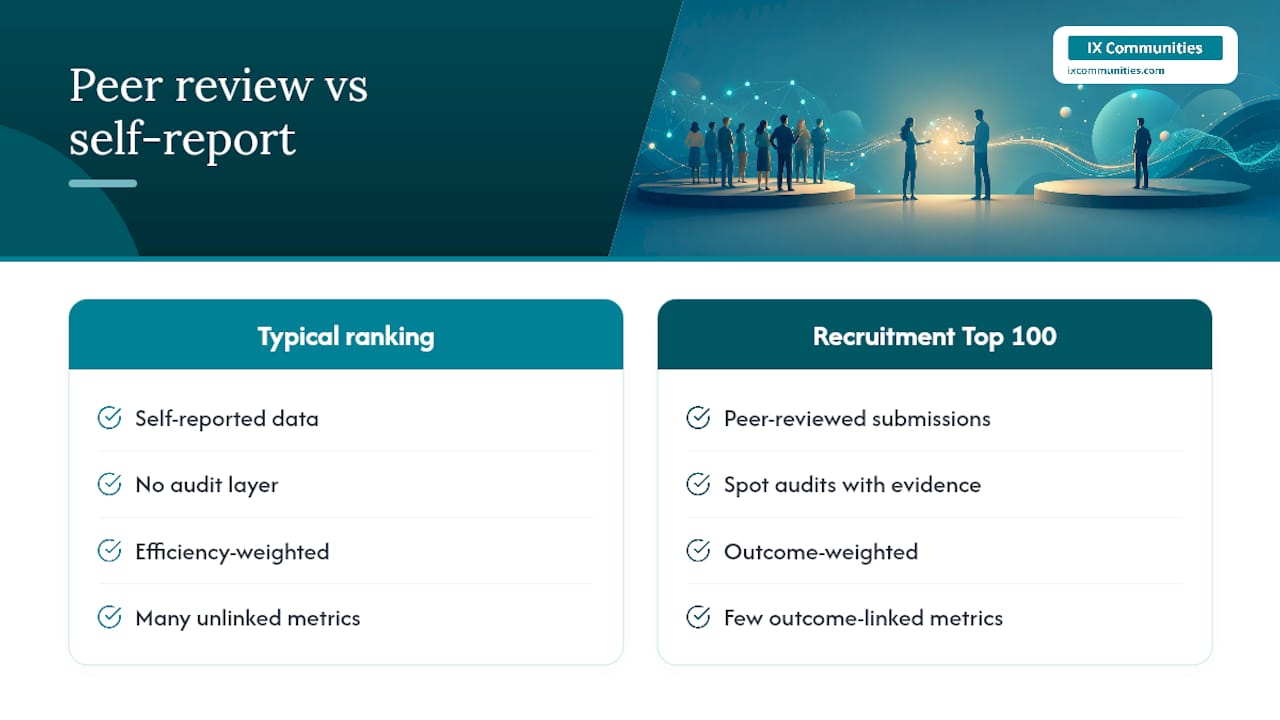
Most published rankings of TA functions rely on self-reported data with no audit layer. The result is a list that reflects which teams are best at filling out surveys, not which teams are actually performing. The Recruitment Top 100 uses a different approach: Ixcommunities member peers review submissions, spot audits request system-generated evidence, and the weighting explicitly favors outcome metrics over efficiency metrics that are easy to game.
The harder question is whether TA leaders are measuring the right things in the first place. Many teams track dozens of metrics without connecting any of them to business outcomes. The teams that consistently appear in top-performer benchmarks have made a deliberate choice to narrow their measurement to a small set of outcome-linked metrics and hold themselves accountable to those numbers publicly. That discipline is harder than any technology implementation, and it is the actual differentiator the data keeps pointing to.
Ixcommunities membership gives TA leaders direct access to the Top 100 process
Ixcommunities members at the ESIX and TLIX levels receive direct access to the benchmarking infrastructure behind the Recruitment Top 100: annual benchmark surveys, comparative performance reports, peer roundtables, and the ESIX Recruiter Peer Mentorship Programs that connect TA leaders with experienced peers working through the same operational challenges.
Membership is the submission pathway for the Top 100 and the ongoing access point for the benchmarking data that makes the ranking useful year over year. Teams that participate in the Benchmark Surveys receive a full comparative report regardless of Top 100 inclusion, giving every submitting team a concrete return on participation. To begin the submission process or explore membership options, visit Ixcommunities.
Useful sources
- 2026 Recruiting Executives Benchmarking: Attracting Critical Talent
- Talent Acquisition Key Benchmarks | APQC
- Source, Recruit, and Select Employees Rapid Performance Assessment | APQC
- Leading and Structuring a High-Performance Talent Acquisition Team | ERE
- What Top-Performing Talent Acquisition Teams Do Differently | GoodTime
- Your Guide to the Modern Talent Acquisition Team | Synopsix
- Recruiting Metrics: The Complete 2026 Guide