
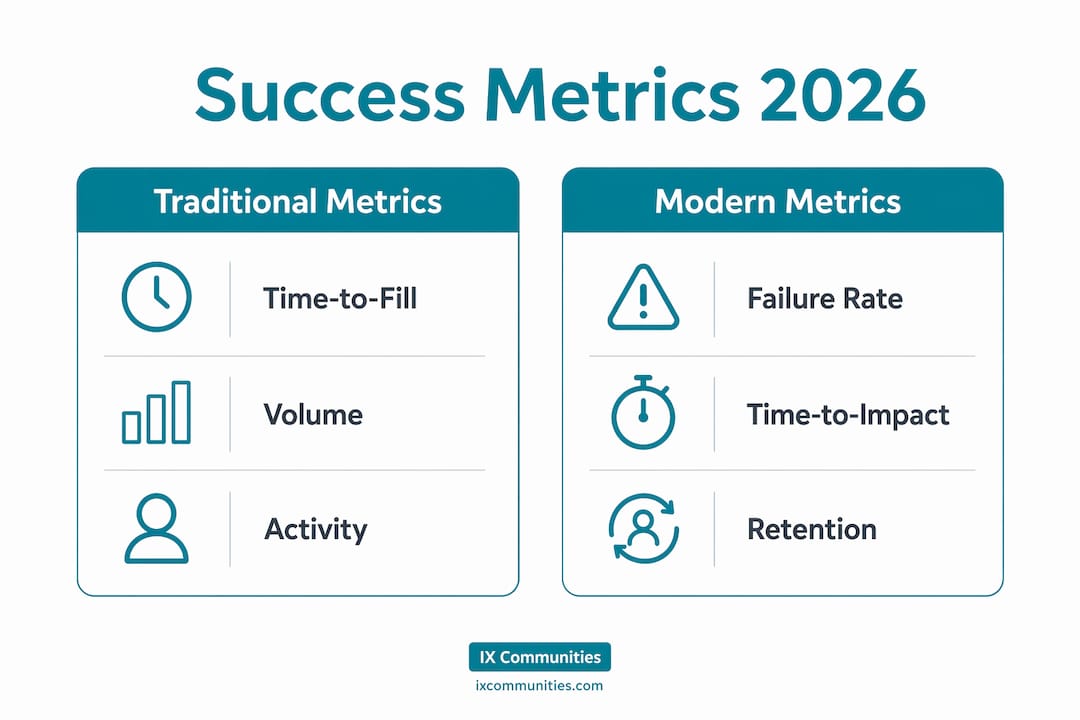
Executive search success is defined by outcome metrics, not activity volume. The shift is clear: in 2026, the most effective talent acquisition teams track failure rate reduction, time-to-impact compression, and post-placement retention rather than resumes submitted or calls made. How executive search teams are measuring success in 2026 reflects a broader move toward structured methodologies, AI-enabled efficiency, and metrics that connect directly to business value. Teams that still rely on basic time-to-fill data are measuring the wrong things and drawing the wrong conclusions.
What are the key success metrics for executive search teams in 2026?
The most consequential metric in executive search is the executive failure rate. Structured retained search methodologies reduce that rate from 40–50% down to 10–15%. That reduction translates to expected value saved of $1.76M to $2.03M per search against a $300K investment.
Time-to-impact is the second core metric. Structured searches compress time-to-impact to 90–120 days, compared to the 6.2-month national average for unstructured hiring. Each delayed month costs roughly $167K in lost productivity for a $2M output role.

Retention tracking now extends to 24 months. Teams that stop measuring at offer acceptance miss the full picture. Post-placement performance data at 12 and 24 months links recruitment directly to business outcomes, closing the measurement loop where most teams leave it open.
AI-driven metrics are reshaping cost and speed benchmarks. The key indicators to track in 2026 include:
- Failure rate: Target 10–15% with structured methodology
- Time-to-impact: Target 90–120 days from search launch to full productivity
- Retention at 24 months: The true test of candidate fit and role clarity
- Cost-per-hire reduction: AI integration reduces cost-per-hire by 30–40%
- Time-to-fill compression: AI achieves up to 85% faster fill times for transactional roles
- Slate quality and diversity: Qualitative measure of candidate relevance and representation
These six metrics give talent acquisition leaders a complete picture of search performance across speed, quality, and long-term value.
How do structured methodologies improve success measurement?
Structured executive search methodologies produce placement success rates of 85–95%, compared to the 71% retained industry average and a 50% baseline for unstructured hiring. That gap is not marginal. It represents the difference between a search function that adds measurable value and one that introduces organizational risk.
Psychometric tools play a direct role in that improvement. Assessments from providers like Hogan and ghSMART improve candidate fit by identifying behavioral tendencies and potential derailment risks before placement. These tools do not replace interviewing. They add a validated layer of evidence that intuition-based processes cannot replicate.
Multi-method interviewing compounds the effect. Structured rubrics, validated skill evaluations, and panel interviews each contribute independent data points. When these methods are combined, predictive hiring quality increases because no single interviewer's bias dominates the outcome.
| Approach | Placement success rate | Mis-hire risk |
|---|---|---|
| Unstructured hiring | ~50% | High |
| Retained search (industry average) | ~71% | Moderate |
| Structured multi-method methodology | 85–95% | Low |
Structured rubrics also integrate directly with AI workflows. Teams that have defined processes get more from AI tools because the AI has clear criteria to match against. Intuition-based firms benefit far less from AI because there is no structured framework for the technology to support.
Pro Tip: Before launching any search, document the specific outcomes the new hire must achieve in the first 90, 180, and 365 days. This single step sharpens every downstream metric from slate quality to retention scoring.
Why are traditional executive search metrics insufficient?
Traditional time-to-fill is a misleading metric. It includes delays caused by hiring manager availability, legal review, and offer negotiation, none of which reflect recruiter performance. Measuring a team by total time-to-fill punishes them for factors outside their control.
The metrics that actually reflect team effectiveness are Time to Candidate Introduction and Time to Hire. Standard time-to-fill averages 123 days, but that number obscures where delays actually occur. Time to Candidate Introduction isolates the recruiter-controlled sourcing and screening phase. Time to Hire measures from first candidate contact to accepted offer. Both metrics give leadership a clear view of where the team performs and where the process breaks down.
Total Addressable Market analysis is another metric that traditional frameworks ignore. TAM analysis quantifies the realistic candidate pool for a given role before the search begins. This matters because it sets accurate stakeholder expectations. When a search team can show that a role with 12 specific requirements has a TAM of 200 qualified candidates nationally, hiring managers make better decisions about which requirements are truly non-negotiable.
Additional metrics that better reflect real team effectiveness include:
- Slate diversity rate: Percentage of underrepresented candidates presented relative to the total pool
- Finalist presentation timeline: Days from search launch to first finalist presented
- Client NPS: Net Promoter Score from hiring managers after search completion
- Repeat engagement rate: Percentage of clients who return for subsequent searches
Pro Tip: Track client NPS separately for searches that resulted in a placement and those that did not. A high NPS on a failed search signals that your process and communication are strong. That data is worth sharing with leadership.
How is AI transforming executive search success measurement?
AI's most measurable impact is on cost and speed. AI integration achieves 30–40% cost-per-hire reduction and up to 85% compression of time-to-fill for transactional executive searches. Those are not projections. They reflect current adoption patterns among teams that have integrated AI into sourcing and screening workflows.
The deeper transformation is in how recruiters spend their time. AI is reallocating recruiter effort from 60% sourcing and 40% advisory to 20–30% sourcing and 70–80% advisory. That shift changes what success looks like for a recruiter. The primary value is no longer finding candidates. It is advising hiring managers, shaping role briefs, and interpreting market data.
AI also improves slate diversity by surfacing candidates who do not appear in standard keyword searches. Research-driven candidate pools increase diversity and meet client mandates more effectively than AI sourcing alone. The combination of AI speed and human research judgment produces slates that are both faster and more representative.
The measurable KPI improvements from AI adoption follow a consistent pattern:
- Administrative time savings: AI reduces administrative workload by 45%, freeing recruiters for higher-value work
- KPI improvement range: Teams report 11–25% gains across traditional recruitment metrics after AI integration
- Sourcing speed: AI screens and ranks candidates in hours rather than days
- Candidate matching accuracy: AI tools trained on structured rubrics produce higher-quality initial shortlists
The teams that gain the most from AI are those with structured methodologies already in place. AI amplifies what is already working. It does not fix a process that lacks defined criteria. Teams still operating on intuition see smaller gains because there is no framework for the AI to reference.
Executive search is also shifting toward what practitioners are calling decision intelligence. The emphasis moves from data quantity to the conviction behind a recommendation. AI handles the data. The recruiter's job is to interpret it and advise with clarity.
Key Takeaways
Executive search teams that measure failure rate reduction, time-to-impact, and post-placement retention at 24 months consistently outperform teams relying on traditional activity-based metrics.
| Point | Details |
|---|---|
| Failure rate is the top metric | Structured methodology reduces executive failure rates from 40–50% to 10–15%, saving up to $2M per search. |
| Time-to-impact beats time-to-fill | Target 90–120 days to full productivity; each delayed month costs roughly $167K for a $2M output role. |
| AI shifts recruiter value | AI moves recruiter time from sourcing to advisory, producing 11–25% KPI gains across the board. |
| TAM analysis sets expectations | Quantifying the candidate pool before search launch aligns stakeholders and improves decision quality. |
| Retention at 24 months closes the loop | Post-placement tracking at 12 and 24 months connects recruitment directly to business outcomes. |
The metric that most teams still get wrong
Role clarity is the highest-leverage investment in executive search, and most teams treat it as a formality. Most executive mismatches stem from poorly defined roles rather than poor candidate sourcing. That finding should change where talent acquisition leaders spend their time before a search launches.
From my perspective, the measurement conversation in 2026 is still too focused on what happens during the search and not enough on what happens before it. Teams that invest two or three additional days in brief development, outcome mapping, and stakeholder alignment consistently see better results across every downstream metric. The search itself becomes faster because the criteria are clear. Slates are stronger because the target is defined. Retention improves because the role was designed for success before anyone was hired.
AI is a genuine force multiplier, but only for teams that have done the upstream work. The firms seeing the largest gains from AI are those with structured rubrics, defined TAM parameters, and clear success criteria already in place. AI accelerates a good process. It does not create one.
The future of executive search belongs to teams that think like strategic advisors rather than process managers. That means owning the measurement framework, reporting transparently on controllable metrics, and tracking placed executives long after the offer is signed. The teams that do this build the kind of credibility that generates repeat business and internal trust.
— Simon
How Ixcommunities supports executive search measurement
Ixcommunities operates ESIX, TLIX, and IXCommunities as the leading peer networking and benchmarking groups for talent leadership professionals worldwide. For teams working to build or refine their measurement frameworks, these programs provide direct access to peers who are solving the same problems.
The ESIX Recruiter Peer Mentorship Programs connect executive search practitioners with experienced mentors focused on best practices in metrics, methodology, and AI integration. The Talent Leaders Peer Mentoring Program addresses leadership development for heads of talent acquisition navigating the shift to outcome-based reporting. Ixcommunities also publishes Benchmark Surveys that give corporate talent teams data-driven comparisons against peer organizations. These resources are available through Ixcommunities membership.
FAQ
What is the most important metric for executive search success?
The executive failure rate is the most consequential metric. Structured methodologies reduce it from 40–50% to 10–15%, generating up to $2M in saved organizational value per search.
Why is time-to-fill a poor measure of executive search performance?
Time-to-fill includes delays outside recruiter control, such as legal review and hiring manager availability. Time to Candidate Introduction and Time to Hire measure only recruiter-controlled phases and provide more accurate performance data.
How does AI improve executive search metrics in 2026?
AI reduces cost-per-hire by 30–40% and compresses time-to-fill by up to 85% for transactional roles. It also reallocates recruiter time from sourcing to advisory work, producing 11–25% gains across standard KPIs.
What is Total Addressable Market analysis in executive search?
TAM analysis quantifies the realistic candidate pool for a specific role before the search begins. It sets accurate stakeholder expectations and helps teams identify which role requirements are limiting the search unnecessarily.
How long should post-placement tracking continue?
Post-placement performance measurement at 12 and 24 months connects recruitment outcomes directly to business results. Tracking beyond offer acceptance is the only way to close the measurement loop and validate long-term hire success.