

By 2026, effective talent benchmarking is short-cycle, skills-first, and AI-augmented. The era of annual headcount reports and job-title-based metrics is giving way to real-time workforce intelligence built around durable skills, speed of hire, and business-aligned outcomes. SHRM's 2026 benchmarking data, drawn from 4,657 respondents, shows a majority of U.S. organizations struggle to fill open roles, with extra-large organizations facing a notably high number of requisitions per recruiter. Mercer's Global Talent Trends 2026 identifies four structural shifts every benchmarking framework must now reflect. Deloitte's 2026 human capital research frames the central challenge as a compressed S-curve where organizational speed and adaptability outpace scale as competitive advantages.
The immediate action: set a time-to-productive-hire baseline and add at least one durable-skills measure to your dashboard this quarter.
- Shift your primary speed metric from time-to-fill to time-to-productive-hire.
- Add durable-skills assessment data to your quality-of-hire calculation.
- Benchmark recruiter workload against the SHRM median to identify burnout risk early.
Key Takeaways
By 2026, talent benchmarking that drives real decisions must be short-cycle, skills-first, and validated against external peer data, not just internal historical trends.
| Point | Details |
|---|---|
| Shift your speed metric | Replace time-to-fill with time-to-productive-hire to reflect AI-accelerated onboarding and real productivity signals. |
| Monitor recruiter workload | SHRM's 2026 median is 100 requisitions per recruiter at extra-large organizations; treat that figure as a burnout risk indicator. |
| Validate AI assessments before use | Run AI and human rater scoring in parallel for at least two quarters before removing the human layer from your benchmarking pipeline. |
| Start with definitions, not tools | A written definitions registry for five core metrics is the prerequisite for any credible benchmarking program. |
| Ixcommunities benchmark surveys | Ixcommunities provides structured peer-comparative benchmark surveys and practitioner communities to validate internal data against market. |
Table of Contents
- What are the four big talent benchmarking trends shaping 2026?
- What metrics should you benchmark in 2026?
- How does TA maturity affect your benchmarking priorities?
- How should you design your benchmarking data strategy?
- Can AI reliably assess durable skills at scale?
- What does a 6–12 month benchmarking roadmap look like?
- A practitioner perspective on what actually works
- Ixcommunities gives you the peer comparators your benchmarking program needs
- Sources
What are the four big talent benchmarking trends shaping 2026?
Four macro forces are reshaping how organizations design and use benchmarking frameworks. Each one requires a deliberate response from HR and TA leaders.
Trend 1: Human-machine work redesign. AI is not eliminating roles wholesale. It is redistributing tasks within them. Benchmarking must now track where AI augments recruiter or analyst work, not just headcount ratios. Mercer's 2026 report is direct on this point: AI delivers value only when work is redesigned around it. Layering tools onto unchanged processes produces marginal gains, which means benchmarks built on pre-AI workflow assumptions will misread performance.
Trend 2: Durable, future-ready skills replace job titles as the unit of measurement. The World Economic Forum's Future of Jobs Report 2025 identifies critical thinking, collaboration, and creativity as the priority competencies for workforce readiness. Benchmarking frameworks that still organize data by job title rather than skill profile will miss the supply-demand signals that matter most.

Trend 3: Speed over scale. Short-cycle benchmarks are replacing annual surveys as the primary instrument.
Deloitte's compressed S-curve framing means that organizations measuring workforce performance annually are already operating on a lag. Real-time talent signals, weekly pipeline reviews, and rolling 90-day trend lines are becoming standard practice for talent acquisition in 2026.
Trend 4: Strategic TA shifts and executive hiring pressure. SHRM's 2026 data shows executive cost-per-hire rose noticeably while nonexecutive costs held steady, reflecting a market where senior talent commands a premium. Meanwhile, SHRM's CHRO benchmarking brief documents belt-tightening in HR budgets alongside continued prioritization of leadership hires. The implication: executive and nonexecutive benchmarks need separate frameworks, not a single blended average. As hiring pressure intensifies across the market, the organizations that segment their benchmarks by role level will make better investment decisions.
What metrics should you benchmark in 2026?
The metrics below represent the core dashboard for mid-to-large enterprise TA functions. Definitions, rationale, cadence, and ownership are specified so teams can build or revise their reporting without ambiguity.
| Metric | Definition | Business Rationale | Cadence | Owner |
|---|---|---|---|---|
| Time-to-productive-hire | Days from req open to new hire reaching full productivity | Reflects true cost of vacancy and onboarding quality | Monthly rolling | TA + HRBP |
| Requisitions per recruiter | Open reqs assigned per full-time recruiter | Workload and burnout risk indicator; SHRM 2026 median is 100 at extra-large orgs | Weekly | TA Operations |
| Cost-per-hire (by level) | Total acquisition spend divided by hires, segmented by exec vs. nonexec | Prevents blended averages from masking executive premium | Quarterly | Finance + TA |
| Quality of hire | Composite of 90-day performance rating, retention at 12 months, and hiring manager satisfaction | Connects TA output to business outcomes | Quarterly | TA + People Analytics |
| Source/channel ROI | Hires and quality scores attributed to each sourcing channel, divided by channel spend | Directs budget to highest-yield sources | Monthly | TA + Marketing |
| Diversity metrics | Representation at each funnel stage and at hire, by role level | Identifies where attrition or bias occurs in the pipeline | Monthly | TA + DEI |
| Internal mobility rate | Share of open roles filled by internal candidates | Measures workforce development effectiveness | Quarterly | HRBP + L&D |
| Retention of critical roles | 12-month retention rate for high-impact or hard-to-fill positions | Signals whether quality-of-hire investments are holding | Quarterly | People Analytics |
Normalizing these metrics for organization size matters. A requisitions-per-recruiter figure of 40 is a healthy workload signal at a midsize company; at an extra-large organization, SHRM's 2026 data shows the median hits 100, which changes the interpretation entirely. Segment every benchmark by org size band and role seniority before drawing conclusions.
The shift from time-to-fill to time-to-productive-hire deserves particular attention. SHRM's 2026 data shows median time-to-fill for nonexecutive roles at 39 calendar days, but that figure says nothing about whether the hire was ready to contribute at 30, 60, or 90 days. AI-accelerated onboarding is compressing ramp times at some organizations, making time-to-productive-hire a more accurate signal of TA effectiveness.
Pro Tip: Quality of hire is the metric with the largest gap between importance and adoption. Start with three inputs: 90-day manager performance rating, 12-month retention, and a structured post-hire interview. Average those scores into a single quality index and track it by source channel.
How does TA maturity affect your benchmarking priorities?
Not every organization is ready to run the full dashboard above. Maturity level determines which metrics are credible, which are aspirational, and where to invest next.
Reactive (Level 1). TA operates on requisition volume with no consistent metric definitions. Data lives in spreadsheets, and reporting is ad hoc. The benchmarking priority here is foundational: establish a definitions registry, connect your ATS to a reporting layer, and track time-to-fill and cost-per-hire at minimum.
- Checklist: Define five core metrics in writing. Assign a single data owner. Pull a baseline report for the last four quarters.
Structured (Level 2). Consistent metric definitions exist, and reporting is regular but backward-looking. The gap is usually quality-of-hire and source ROI. The benchmarking priority is adding outcome metrics alongside process metrics.
- Checklist: Pilot quality-of-hire tracking for one role family. Add source attribution to your ATS. Begin external peer comparisons using published benchmarks.
Strategic (Level 3). TA has a seat at workforce planning discussions. Metrics are segmented by role level, and data informs budget decisions. The benchmarking priority is real-time signals and skills-level data.
- Checklist: Move to monthly rolling dashboards. Add durable-skills assessment data to quality-of-hire. Segment executive and nonexecutive benchmarks separately.
Orchestrated (Level 4). TA functions as a talent intelligence hub. Benchmarks feed directly into business planning, and skills supply maps inform hiring and development decisions simultaneously. The benchmarking priority is predictive modeling and external peer validation.
- Checklist: Participate in structured peer benchmarking surveys. Integrate workforce supply data with finance planning cycles. Publish quarterly talent intelligence briefs for the CHRO and CFO.
Extra-large organizations face a specific challenge: recruiter workload at 100 requisitions per recruiter is a risk signal, not a benchmark to normalize. At that level, the optimal benchmarking focus shifts to capacity planning and workload distribution rather than speed alone. Midsize organizations, by contrast, can prioritize quality metrics earlier because recruiter bandwidth is less constrained.
How should you design your benchmarking data strategy?
A credible benchmarking program requires deliberate decisions about sources, sampling, governance, and privacy before the first data point is collected.
- Define before you measure. Every metric needs a written definition, a calculation method, and a version date. Without a definitions registry, year-over-year comparisons are unreliable.
- Map your data sources. Internal ATS and HRIS data covers process metrics. External peer surveys provide comparators. Structured assessments add skills-level data. No single source covers all three.
- Set a normalization protocol. Segment data by org size, industry, and role level before comparing to external benchmarks. A blended average across all role levels obscures the executive premium SHRM's 2026 data documents.
- Establish cadence by metric type. Real-time or weekly for pipeline and workload metrics; monthly rolling for speed and source metrics; quarterly for outcome metrics like quality-of-hire and retention.
- Assign ownership. Each metric needs one accountable owner. Shared ownership without a primary lead produces reporting gaps.
- Build a governance layer. Document metadata, track definition changes, and version your dashboards. This is what makes benchmarks auditable and repeatable.
| Data Source | Metric Types | Typical Cadence | Suggested Owner |
|---|---|---|---|
| ATS (e.g., Workday, Greenhouse) | Time-to-fill, source, pipeline conversion | Weekly/Monthly | TA Operations |
| HRIS (e.g., SAP SuccessFactors) | Retention, internal mobility, headcount | Monthly/Quarterly | People Analytics |
| Skills assessments | Durable skills scores, role readiness | Per hire cycle | TA + L&D |
| Peer benchmarking surveys | External comparators for all core KPIs | Quarterly/Annual | TA + HR Strategy |
| Finance systems | Cost-per-hire, budget variance | Quarterly | Finance + TA |
Privacy and compliance deserve explicit attention for U.S. operations. Candidate and employee data used in benchmarking is subject to EEOC guidelines, state-level privacy laws, and emerging AI-in-hiring regulations. Managing consent for HR data is a practical requirement, not a formality, particularly when assessment data from third-party tools enters your benchmarking pipeline.
External peer benchmarking and internal longitudinal baselines serve different purposes. Internal baselines tell you whether you are improving. External peer data tells you whether your improvement rate is competitive. Both are necessary; neither is sufficient alone.
Can AI reliably assess durable skills at scale?
AI-enabled skills assessment is moving from experiment to practice, but the validation requirements are non-negotiable before any assessment output enters a benchmarking framework.
Google's Vantage research, conducted in partnership with NYU, demonstrated that a generative AI approach produced assessment scores for future-ready skills with inter-rater agreement comparable to human raters. The pilot involved hundreds of testers, and the results suggest scalable options for organizations that cannot run large-scale human-rater panels.
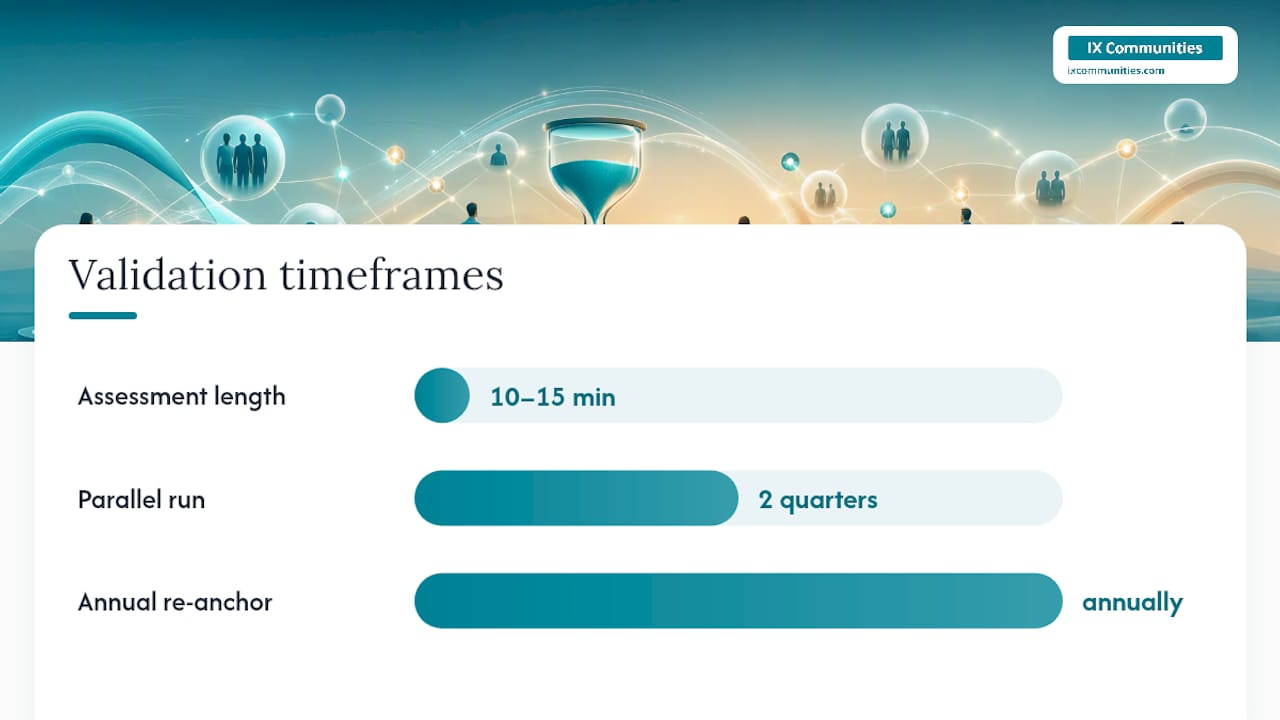
ETS's Futurenav Edge takes a complementary approach: short assessments of 10–15 minutes, combined with multi-modal AI video analysis, designed to produce rapid skills insights for hiring and upskilling decisions. The brevity matters for enterprise adoption, where assessment fatigue is a real barrier.
Before integrating any AI assessment output into benchmarks, work through this validation checklist:
- Construct validity: Does the assessment measure the skill it claims to measure? Review the technical manual and published validation studies.
- Inter-rater agreement: How closely do AI scores align with trained human raters on the same samples? Request pilot data from the vendor.
- Pilot sample size: Run an internal pilot with a representative sample before scaling. Hundreds of participants, not dozens, provide reliable signal.
- Bias testing: Examine score distributions across demographic groups. Flag any differential impact and require vendor remediation before deployment.
- Periodic recalibration: AI models drift. Schedule quarterly reviews of score distributions and re-anchor against human rater panels annually.
Translating assessment scores into benchmarks requires one additional step: map scores to role readiness thresholds, not just percentile ranks. A score in the 70th percentile means little without a defined threshold for "ready to contribute in role X." Build that threshold collaboratively with hiring managers and validate it against 90-day performance data.
Pro Tip: During rollout, treat AI scoring as a complement to human raters, not a replacement. Run both in parallel for the first two quarters, publish the agreement rates internally, and use that data to build stakeholder confidence before removing the human rater layer.
What does a 6–12 month benchmarking roadmap look like?
The following roadmap gives TA and HR leaders a quarter-by-quarter implementation path. It is designed for organizations at Level 2 or Level 3 maturity moving toward a fully modernized benchmarking program.
-
Q1: Definitions and baseline. Audit current metrics for definition consistency. Build a written definitions registry. Pull a four-quarter baseline for time-to-fill, cost-per-hire, and requisitions per recruiter. Identify data gaps in quality-of-hire and source ROI. Stakeholder question for the CHRO: "Which three metrics would change a budget decision if they moved 20%?"
-
Q2: Pilot AI/skills assessment and revise dashboards. Select one role family for a durable-skills assessment pilot. Run AI and human rater scoring in parallel. Add time-to-productive-hire to the dashboard alongside time-to-fill. Present revised dashboard to the Head of TA and CFO for alignment on definitions and ownership.
-
Q3: Scale measurement and governance. Expand skills assessment to two additional role families. Formalize the governance layer: metadata documentation, version control, and a quarterly definitions review. Join an external peer benchmarking survey to validate internal baselines against market comparators. Stakeholder question for the CFO: "How does our cost-per-hire at the executive level compare to market, and what is the cost of a mis-hire at that level?"
-
Q4: Embed into talent decisions and executive reporting. Integrate benchmarking outputs into workforce planning and headcount approval processes. Publish a quarterly talent intelligence brief for the CHRO. Present quality-of-hire trends by source channel to inform the next-year sourcing budget. Confirm recalibration schedule for AI assessment tools.
Resourcing checklist for the full roadmap:
- One dedicated People Analytics resource or a shared analyst with 50% allocation to TA metrics.
- ATS and HRIS configured for consistent data extraction (not manual exports).
- A peer benchmarking membership or survey participation for external comparators.
- A change management plan that includes manager training on quality-of-hire inputs and stakeholder briefings at each quarter milestone.
A practitioner perspective on what actually works
The most common failure in benchmarking programs is not a data problem. It is a definitions problem that looks like a data problem. Organizations spend months building dashboards before discovering that two business units define "time-to-fill" differently, one counting from req approval and the other from job posting. The resulting numbers are not comparable, and the dashboard loses credibility with the leadership team that was supposed to use it.
The corrective action that works consistently: start with a definitions workshop, not a tool selection. Bring TA operations, People Analytics, and at least one HRBP into a two-hour session. Agree on five core metric definitions in writing before touching any reporting infrastructure. That session is worth more than any analytics platform.
The shift from job-level to skills-level benchmarking surfaces a similar adoption barrier. When one large enterprise reorganized its quality-of-hire tracking from role titles to skill clusters, the initial reaction from hiring managers was resistance. The metrics looked unfamiliar, and the thresholds felt arbitrary. The fix was straightforward: publish the validation data. Show managers the correlation between skills assessment scores and 90-day performance ratings. Once the connection between the new metric and a business outcome they already trusted was visible, adoption followed.
Governance is the third common gap. Benchmarking programs that lack a named owner for each metric tend to drift. Definitions change informally, cadence slips, and within two quarters the data is no longer comparable year-over-year. Assign ownership explicitly, document it, and review it annually alongside the definitions registry.
Ixcommunities gives you the peer comparators your benchmarking program needs
Most organizations building a 2026 benchmarking program face the same gap: internal data tells you where you are, but without external comparators from organizations of similar size and industry, you cannot tell whether your performance is competitive. That is the specific problem Ixcommunities solves.
Ixcommunities operates ESIX, TLIX, and IX Communities, the preeminent peer networking and benchmarking groups for corporate talent and recruiting leaders. Members access structured benchmark surveys that produce peer-comparative data across the core KPIs covered in this guide, including time-to-productive-hire, cost-per-hire by level, and quality-of-hire. The ESIX Recruiter Peer Mentorship Program connects TA leaders with practitioners who have already navigated the maturity transitions described above. Membership provides ongoing access to benchmarking reports, expert speaker sessions, and a secure peer community where definitions, governance models, and assessment approaches are shared directly among practitioners. Review the membership options and benchmark survey offerings to find the right entry point for your organization.
Sources
The following sources underpin the claims and frameworks in this guide. Each is worth reviewing directly for methodology details and extended findings.
- 2026 Recruiting Executives Benchmarking: Attracting Critical Talent
- Global Talent Trends 2026
- 2026 Global Human Capital Trends | Deloitte Insights
- Towards developing future-ready skills with generative AI
- Futurenav™ Edge in action