

Roughly 6% of job viewers apply, about 3% of applicants reach an interview, and interview-to-hire runs near 27%, which puts most funnels close to one hire per 180 applicants. Screening is the single largest leak in that chain, while sourcing mix and hiring speed are the two levers that move the needle fastest. Every one of these figures shifts by industry, role family, and company size, so the sections below break down where your funnel should sit and what to fix first.
TL;DR:
- Screening remains the largest leak, with only about 8% of applicants passing initial screening, which varies by company size and hiring process rigor.
- To fill a 40-hire target with a 150-application-per-hire ratio, roughly 6,000 applicants need to be in the pipeline, emphasizing the importance of early sourcing and screening efficiencies.
- Speed in scheduling interviews and making offers directly affects candidate dropout rates, with delays beyond three days or two weeks noticeably harming acceptance rates.
- Referral channels outperform inbound applicants by passing candidates through the funnel at higher rates, making them a highly valuable sourcing strategy.
- Benchmarks serve as a guide, but tailored experimentation and peer comparison are crucial for identifying real gaps and effective fixes in specific hiring contexts.
Table of Contents
- What Are Recruiting Funnel Benchmarks by Stage?
- How Many Applicants Does It Take to Make One Hire?
- How Long Should Each Hiring Stage Take?
- Where Do Candidates Drop Out of the Funnel Most Often?
- How Does Sourcing Channel Affect Funnel Performance?
- How Do You Use Benchmarks to Prioritize Funnel Fixes?
- What Quality of Hire Benchmarks Should You Track by Stage?
- What Candidate Experience Scores Should You Expect Across the Funnel?
- Do Recruiting Funnel Benchmarks Vary by Employer Brand?
- How Do Funnel Metrics Differ by Region?
- What Should You Actually Change Based on Benchmark Gaps?
- Why Peer Benchmarking Complements Public Recruiting Data
- A Practitioner's Note on Using These Numbers
- Turn Benchmarks Into Practical Skills With IX Academy
- Sources
- FAQ
What Are Recruiting Funnel Benchmarks by Stage?
Recruiting funnel benchmarks measure how many candidates survive each transition, from a job view to a signed offer. Getting these numbers right requires consistent definitions first. A "screen" at one company means a recruiter phone call; at another, it means an automated résumé filter. Compare your funnel to public data only after you have confirmed you are counting the same events.
According to data from Pin's 2026 conversion benchmarks, the stage-by-stage averages look like this:
- Job view to application (click-to-apply): around 6%. Long applications, mobile friction, and unclear pay ranges push this lower.
- Application to interview: about 3% advance from a submitted application to a scheduled interview.
- Screened to interview: Gem's 2026 recruiting benchmarks, drawn from 165 million applicants and 1.2 million hires between June 2021 and May 2025, found only about 8% of applicants make it past initial screening in some datasets.
- Interview to offer: general hiring trails campus recruiting here. NACE data puts college interview-to-offer near 47.5%, well above typical experienced-hire conversion.
- Offer to acceptance: the final gate, and the one most sensitive to speed and source.
Statistic Callout: Gem's dataset shows roughly 0.5% of applicants ultimately receive an offer in some samples, with larger organizations filtering more aggressively early but converting better once a candidate reaches the final rounds.
Sample size and methodology explain most of the variance between reports. A dataset built from ATS logs across thousands of companies (like Gem's) will read differently than one weighted toward a single job board's traffic (like Pin's). When you pick a benchmark to compare against, match it to your company size and hiring volume, not just the industry label on the report.
How Many Applicants Does It Take to Make One Hire?
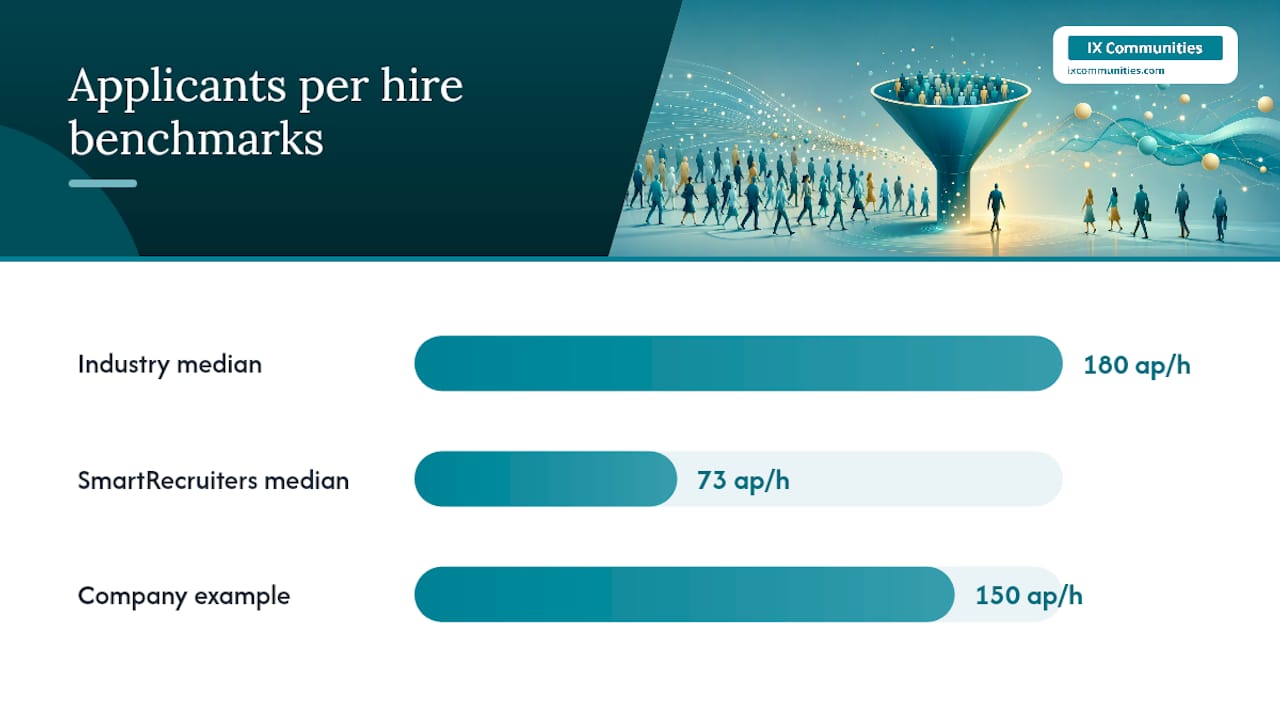
Applicant-to-hire ratios sit near 1:180 in broad industry data, but that number hides enormous variation. SmartRecruiters' global benchmarking reports a global median of about 73 applicants per role, with roughly 3 candidates interviewed and 1 offer extended, a tighter funnel than the 180:1 figure because it reflects a different mix of roles and markets.
Company size changes the shape of the funnel more than most recruiters expect:
- Large enterprises tend to filter harder at the top of the funnel (more applicants per role, stricter early screens) but convert better from interview to offer because their process is more deliberate.
- Smaller and mid-market companies often see fewer applicants but softer screening criteria, which pushes more of the selection work into later, costlier stages.
- Tech and high-volume white-collar roles generally see higher applicant-per-hire ratios than healthcare or skilled trades, where the labor pool is smaller and more targeted.
Turn the ratio into a planning tool by working backward. If your team needs 40 hires this quarter and your applicant-per-hire ratio runs at 150:1, you need roughly 6,000 applicants in the pipeline, sourced early enough to clear screening, interview, and offer stages before your deadline. That same math tells you how many open requisitions one recruiter can realistically carry without falling behind.
How Long Should Each Hiring Stage Take?
U.S. median time-to-fill sits around 45 days, with median cost-per-hire near $1,200, according to SHRM's 2025 benchmarking research. That 45-day figure is a blended median across roles and industries, so treat it as a starting reference, not a target for every requisition.
The intervals inside that 45-day window matter more than the total. Slow scheduling is one of the most common points where candidates disengage.
- Time to review a new application should be measured in hours, not days, especially for high-demand roles.
- Time to first interview is where automated scheduling makes the clearest difference.
- Time to offer compounds delays from every earlier stage.
- Global median time-to-hire runs near 38 days according to SmartRecruiters, and teams using AI-assisted workflows hire about 26% faster.
Statistic Callout: Ashby's 2026 Talent Trends Report found automated scheduling runs about 26% faster than manual scheduling, a gap that directly reduces the window in which candidates accept a competing offer.
Set targets by segment rather than a single company-wide SLA. Technical roles with panel interviews and take-home assessments will never hit the same time-to-interview number as a retail or hourly role with a single conversation. A blended target flattens that difference and makes both segments look artificially good or bad.
Where Do Candidates Drop Out of the Funnel Most Often?
Four leakage points account for most funnel loss, and each has its own diagnostic.
- Application abandonment. Long forms and unclear compensation ranges drive candidates away before they submit. Check your application completion rate against form length; anything past 10 fields tends to see a measurable drop.
- Screening rules that filter too aggressively. Keyword-based ATS filters routinely reject qualified candidates. Audit your filter criteria quarterly against people who were hired despite not matching every keyword.
- Interview scheduling delays. Track days-to-schedule from the moment an interview is requested. Anything beyond two to three business days invites candidates to accept another offer.
- Offer-to-start gap. Measure days from offer to signed acceptance, then days from signed acceptance to start date. Long notice periods and slow background checks quietly erode acceptance rates even after a candidate says yes.
Pro Tip: Run a simple ATS filter audit once a quarter by pulling ten recent hires and checking whether your automated screen would have advanced them on the first pass. If it wouldn't have, your filter is costing you talent you already know is viable.
Match each leak to a fix sized to its cause. Form abandonment usually needs a shorter application, not a new careers page. Scheduling delays usually need automation, not more recruiters.
How Does Sourcing Channel Affect Funnel Performance?
Referrals consistently outperform every other channel, often by a wide margin. Ashby's operations benchmarks found referred candidates pass initial screens at rates well above the general applicant pool in some samples, a pattern that holds across most industries and role levels.
Channel mix reshapes both funnel volume and funnel quality:
- Referrals bring fewer total applicants but the highest passthrough at nearly every stage, since a trusted employee has already done informal pre-screening.
- Inbound applicants (careers page, job boards) generate the highest volume and the lowest passthrough, which is why click-to-apply and screening benchmarks skew heavily toward this channel.
- Sourced candidates (recruiter outreach) convert better than inbound because they are pre-qualified against the role before first contact.
- Agency-sourced candidates often show strong interview-to-offer rates but add cost and reduce a company's direct control over candidate experience.
- AI-assisted sourcing is changing entry volume and quality simultaneously. Teams using AI in their hiring workflow hire roughly 26% faster according to SmartRecruiters, largely by widening the top of the funnel without proportionally increasing recruiter screening time.
Statistic Callout: Ashby's data shows referred candidates passing initial screens at meaningfully higher rates than the overall applicant pool, reinforcing why referral programs remain one of the highest-yield investments in the funnel.
Build your dashboard around channel-specific benchmarks rather than one blended conversion rate per stage.
How Do You Use Benchmarks to Prioritize Funnel Fixes?
Benchmarks only create value when they point to a specific action. Three steps get you there:
- Align definitions and segment your data by role family, source, and seniority before comparing anything to a public benchmark. A single blended number will mask where the real gap lives.
- Rank gaps by impact times fixability. A 5-point gap in offer acceptance among senior engineers matters more than a 2-point gap in application completion for an entry-level role that already fills easily.
- Run a defined experiment with a measurement window. Pilot automated scheduling for one job family over four weeks. A/B test a shorter application form against your current one over two hiring cycles. Push a targeted referral campaign for a hard-to-fill role and track passthrough for 60 days.
Pro Tip: Your reporting dashboard should show, at minimum, conversion rate per stage, days per stage, applicants per hire, and acceptance rate, each segmented by role family and source. If leadership can only see a blended time-to-fill number, they cannot tell you where to invest next.
What Quality of Hire Benchmarks Should You Track by Stage?
Quality of hire is the metric most funnels measure too late to act on. Tying it back to earlier stages turns it into a diagnostic instead of a retrospective scorecard.
Track new-hire performance ratings or 90-day retention against the source and interview panel that produced each hire. If sourced candidates consistently outperform inbound applicants on manager ratings six months in, that is a signal to shift budget toward sourcing even if inbound volume looks healthier on paper. If a specific interview panel or hiring manager consistently produces hires with weaker 90-day retention, the gap usually traces back to interview calibration, not candidate quality.
Connect quality of hire to the screening stage specifically. If your ATS filters are rejecting candidates who, based on manager feedback, would have performed well, your quality-of-hire numbers are quietly capped by a screening rule nobody has audited recently. Pairing quality data with funnel-stage data is what separates a team that hires fast from a team that hires well. The two are not the same, and a funnel optimized purely for speed can quietly erode quality of hire if screening criteria loosen just to hit a time-to-fill target.
What Candidate Experience Scores Should You Expect Across the Funnel?
Candidate experience benchmarks, most often tracked as Net Promoter Score at key touchpoints, tend to decline the longer a candidate waits between stages. The pattern is consistent enough to build a rule around: every added day of silence between application and first response measurably lowers how a candidate rates the process, even if they are eventually hired.
Measure candidate NPS at three points minimum: after the application confirmation, after the interview, and after the final decision, regardless of outcome. Rejected candidates who report a positive experience often reapply later or refer others, while candidates who accept an offer but rate the process poorly are more prone to early attrition.
CandE's research on offer acceptance, drawn from 19 million candidate responses, ties acceptance behavior directly to experience factors like communication speed and compensation transparency during the closing stage. Candidates who feel informed throughout the process accept offers at higher rates than those who receive a surprise counteroffer negotiation at the finish line. That single data point argues for treating candidate experience as a funnel metric, not a satisfaction survey you run once a year.
Do Recruiting Funnel Benchmarks Vary by Employer Brand?
Employer brand strength changes funnel performance most visibly at the top and the very bottom. Strong brands see higher click-to-apply rates because candidates already trust the company before reading the job description, and they see higher offer acceptance because candidates have fewer doubts to resolve during negotiation.
The effect is measurable in practice even without a formal brand score. The same strength shows up again at offer acceptance, where candidates who came in with positive brand perception need less convincing during the final stage.
Weak or inconsistent employer brand shows up as a specific pattern: healthy top-of-funnel volume from job board aggregation, but poor screen-to-interview conversion because candidates who apply broadly without brand affinity are less qualified or less committed on average. If your funnel shows high application volume paired with weak mid-funnel conversion, brand perception is one of the first things worth investigating, alongside job description clarity and pay transparency.
How Do Funnel Metrics Differ by Region?
Regional variation shows up most in time-to-fill and applicant volume, less in the shape of conversion rates stage to stage. U.S. median time-to-fill runs near 45 days per SHRM's benchmarking, while SmartRecruiters' global median sits closer to 38 days across the markets in its dataset, a gap likely driven by differences in labor market regulation, notice periods, and interview process norms outside the U.S.
Labor market density explains most of the difference in applicant-per-hire ratios by region. Dense urban labor markets with many comparable employers generate higher applicant volume per role but often lower passthrough quality, while tighter regional labor markets produce fewer applicants who are, on average, closer matches. Multinational teams hiring across regions should benchmark each market separately rather than applying a single global target, since a 45-day time-to-fill might be strong performance in one country and a warning sign in another. Companies with international hiring needs, including those managing employer-of-record arrangements for cross-border roles, should treat regional benchmarks as a starting point refined by their own historical data rather than a fixed standard.
What Should You Actually Change Based on Benchmark Gaps?
Every benchmark gap points to a different fix, and the biggest mistake teams make is applying the same solution everywhere.
If your click-to-apply rate trails the 6% average, start with the application itself: field count, mobile experience, and whether pay range appears before the candidate has to click through. If screen-to-interview conversion lags, audit ATS filter logic before assuming the candidate pool is weak. If interview-to-offer is strong but offer-to-acceptance is soft, the fix is almost always speed and transparency, not a bigger pay bump, according to CandE's acceptance research, which ties acceptance more closely to how fast an offer arrives and how clearly compensation was discussed earlier in the process.
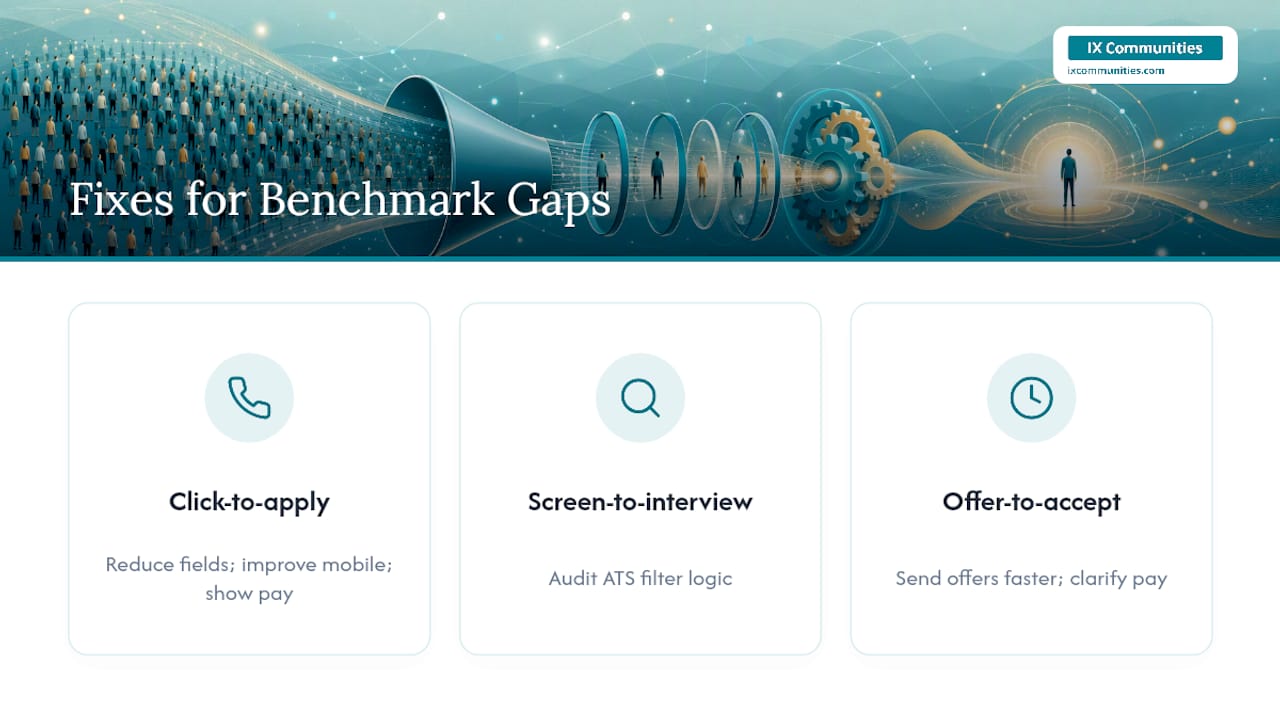
Sequence your fixes by where the funnel leaks hardest, not by what is easiest to change. A perfectly optimized application form does nothing for a team losing candidates to a two-week scheduling delay. Pilot one fix at a time, measure it against the specific stage benchmark it targets, and only roll it out broadly once the pilot data confirms the gap actually closed. Benchmarks tell you where to look; they do not tell you what will work in your specific hiring context, which is exactly why segmented experimentation matters more than matching a published average.
Why Peer Benchmarking Complements Public Recruiting Data
Public benchmarks tell you where the industry sits on average. They cannot tell you whether your interview-to-offer rate for senior engineering roles in your specific labor market and comp band is healthy, because no public report segments that precisely. That gap is where confidential, like-for-like peer benchmarking becomes useful. Comparing your funnel against organizations matched by size, industry, and role family, rather than a blended national average, turns a benchmark from a curiosity into an operational decision.
Supplement public data with peer benchmarking once your team has segmented its own numbers and identified a specific gap. Public reports are the right starting point for a first pass; peer data is the right tool for confirming whether that gap is normal for your peer group or a real problem worth fixing.
A Practitioner's Note on Using These Numbers
Benchmarks are a starting compass, not a scoreboard. The mistake I see most often is teams chasing a global average instead of asking whether their gap is real for their specific role family and market. Segment first, pilot small changes, then measure. If your team is ready to compare notes with peers facing the same hiring conditions, that is where enterprise-level benchmarking earns its place.
— Simon
Turn Benchmarks Into Practical Skills With IX Academy
Knowing your interview-to-offer rate lags the benchmark is only useful if your team knows how to close that gap. Some organizations give talent acquisition leaders both sides of that equation: confidential peer benchmarking through membership communities, and practical training through specialized academies that turn a diagnosed gap into a fixed process.
Membership in TLIX connects heads of talent acquisition with peers at comparable companies for benchmarking that goes beyond published averages, in a vendor-free environment built specifically for in-house recruiting leaders. Executive search leaders can find the same peer structure through ESIX, and diversity recruiting leaders through DSIX. For teams that need to fix a specific funnel stage now, IX Academy offers on-demand courses starting at $350, live online courses from $750, and team intact training from $3,000, covering the exact skills that move screening, interview, and offer conversion. Start by reviewing membership options and picking the community that matches your role.
Sources
- Recruitment Funnel Benchmarks 2026: Conversion Rates by Stage - Pin
- Key takeaways from the 2026 Recruiting Benchmarks Report - Gem
- Recruiting Operations Benchmarks | 2026 Talent Trends Report | Ashby
- SHRM recruiting benchmarking 2025
FAQ
What Are Recruitment Funnel Metrics?
Recruitment funnel metrics measure candidate conversion at each hiring stage, including click-to-apply, application-to-interview, interview-to-offer, and offer-to-acceptance, along with time spent at each stage.
What Is the 70/30 Rule in Hiring?
There is no single standardized "70/30 rule" in recruiting; the term is used inconsistently across sources to describe skills-versus-culture-fit weighting or sourcing-versus-inbound splits, so treat any specific figure attached to it with caution.
What Is the 80/20 Rule in Recruiting?
The 80/20 rule is commonly applied to suggest that a small share of sourcing channels, often referrals, produce a disproportionate share of quality hires, though the exact ratio varies by organization rather than following a fixed 80/20 split.
What Are Good KPIs for Recruiters?
Strong recruiter KPIs include time-to-fill, applicant-to-hire ratio, offer acceptance rate, source-of-hire quality, and stage-by-stage conversion rates, tracked by role family rather than as a single blended company average.
How Can Peer Benchmarking Help Beyond Public Reports?
Confidential peer benchmarking through communities like Ixcommunities lets talent leaders compare funnel performance against organizations matched by size and industry, filling gaps that broad public averages cannot address.