

Six categories of recruiting benchmarking metrics determine whether a talent acquisition function is competitive: speed (time to fill, time to hire), funnel conversion, quality and retention, source effectiveness, cost and recruiter productivity, and candidate experience. The immediate next step is to run a 90-day baseline segmented by role level and compare results against relevant cohort benchmarks, not blended industry averages. The table below gives you the ranges to start with.
TL;DR:
- Running a 90-day baseline segmented by role level is essential for accurate benchmarking, as role complexity significantly impacts key metrics.
- Prioritize tracking time to first fill and time to archive, as delays in sourcing and candidate removal can distort overall process efficiency.
- High open requisitions per recruiter beyond 30 over several months indicate staffing issues that could affect the quality and speed of hiring.
- Benchmark data must reflect automation levels used by organizations, as AI adoption accelerates hiring speed by approximately 26%, influencing relevant metric ranges.
Table of Contents
- What Are the Core Recruiting Benchmarking Metrics to Track?
- How Long Should Time to Fill and Time to Hire Take?
- What Passthrough Rates Indicate a Healthy Hiring Funnel?
- How Do You Measure Quality of Hire and Early Retention?
- Which Sourcing Channels Actually Produce Better Hires?
- What Does Cost Per Hire and Recruiter Productivity Look Like?
- How Do You Set Realistic Recruiting Benchmarks and Targets?
- Why Peer Benchmarking Communities Speed Up Target Validation
- How Should You Measure Diversity Hiring and Inclusive Recruitment?
- What Legal and Compliance Issues Affect Recruiting Metrics?
- How Do Recruiting Metrics Connect to Broader Business KPIs?
- How Is Automation Changing Recruiting Benchmark Standards?
- What TA Leaders Consistently Get Wrong About Benchmarking
- Get Peer-Validated Benchmarks Through Ixcommunities
- Where to Find Authoritative Recruiting Benchmark Data
- Sources
- FAQ
What Are the Core Recruiting Benchmarking Metrics to Track?
Before comparing your numbers to anyone else's, you need a shared reference point. The table below lists the ten metrics most talent acquisition teams should monitor monthly, with typical ranges and where top-quartile performers land.
Role level changes these numbers more than almost any other variable. An entry-level operations hire and a director-level finance hire should never share the same time-to-fill target, and blending them into one company-wide average hides where the real problems sit.
How Long Should Time to Fill and Time to Hire Take?
Time to fill measures the days between requisition approval and an accepted offer. Time to hire measures the days between a candidate's application and their accepted offer. The distinction matters because time to fill captures your sourcing and process efficiency, while time to hire captures the candidate's actual experience moving through your funnel.
The global median time to hire is roughly 38 days, and organizations that use AI in their recruiting workflow hire about 26% faster than that median. Two related, less-discussed metrics deserve equal attention:
- Time to first fill tracks how long it takes a newly opened requisition to get its first qualified applicant, an early warning sign for weak sourcing channels.
- Time to archive tracks how long a closed requisition and its candidates sit open in the system after a decision is made.
Most delays trace back to three culprits: slow interviewer scheduling, multi-layer approval chains, and sluggish offer turnaround after a final interview. Scheduling in particular deserves scrutiny. Automated scheduling tools confirm interviews roughly 26% faster than manual back-and-forth, and small delays at each stage compound into weeks of lost time by the time a candidate reaches an offer.
Pro Tip: Track Time to Archive as a standalone metric, not an afterthought. Requisitions left open after a hire decision distort your reporting and leave rejected candidates in limbo, which drags down candidate NPS.
What Passthrough Rates Indicate a Healthy Hiring Funnel?
Funnel conversion, sometimes called passthrough rate, measures what percentage of candidates advance from one stage to the next. A healthy funnel generally looks like this:
- Application to screen: 20–35% of applicants get a recruiter screen, lower for high-volume roles with heavy job board traffic.
- Screen to interview: 40–60% of screened candidates move to a hiring manager or panel interview.
- Interview to offer: 20–35% of interviewed candidates receive an offer, tighter for senior or highly technical roles.
- Offer to hire: 80–90% of extended offers get accepted, the acceptance rate benchmark from the table above.
Source and role complexity shift these numbers meaningfully. Referred candidates pass initial screens at a noticeably higher rate than the overall candidate pool, a pattern covered in more depth below. A role with a narrow, highly specific skill requirement will show fewer applicants but a tighter, more efficient interview-to-offer ratio, while a high-volume role sees the opposite: many applicants, but heavy attrition early in the funnel.
When a stage underperforms, diagnose it by segment rather than guessing. Pull passthrough by role family first, then by sourcing channel, then by hiring team. Application volume has surged industry-wide, and Greenhouse's analysis of 640 million applications across 6,000 companies shows recruiter workload climbing right alongside it, which makes a bottleneck at the screening stage the most common failure point worth checking first.
How Do You Measure Quality of Hire and Early Retention?
Quality of hire is the metric every talent leader wants and the one most teams measure badly. The most defensible approach combines a calibrated 90-day performance scorecard, a structured hiring manager satisfaction survey, and retention data tracked at fixed intervals rather than left to anecdote.
- 90-day retention should sit between 90% and 95%; anything lower points to a selection mismatch or a rocky onboarding experience.
- 1-year retention typically falls between 80% and 88%, with top performers holding above 90%.
- Hiring manager satisfaction, gathered 30 to 60 days post-hire, gives you the qualitative half of the picture that retention numbers alone miss.
Retention data and manager feedback need to be triangulated, not treated as separate reports. A hire who clears 90 days but earns lukewarm manager ratings is a different problem than a hire who leaves at 75 days despite strong early feedback. Leading benchmarking reports recommend pairing performance and retention data with structured manager ratings specifically because neither signal alone tells the full story. SHRM's benchmarking research offers useful executive-level context here, since it frames retention and offer-acceptance data as metrics that belong in leadership reporting, not just recruiter dashboards.
Which Sourcing Channels Actually Produce Better Hires?
Not all sources perform equally, and treating "hires by source" as a vanity metric wastes the most useful data your funnel produces. Referrals, direct sourcing, inbound applications, job boards, and agency placements each carry distinct cost, speed, and quality profiles.
- Referrals consistently show the strongest passthrough and retention performance of any channel.
- Direct sourcing tends to produce lower volume but higher-fit candidates for hard-to-fill or senior roles.
- Inbound applications deliver the highest volume at the lowest per-applicant cost, offset by lower passthrough rates.
- Agencies carry the highest cost per hire but can compress time to fill for urgent or highly specialized searches.
Referred candidates pass initial screens at roughly 52%, compared with 35% overall across the broader candidate pool. That gap alone justifies reviewing referral program investment before adding more job board spend.
Build a source scorecard that tracks applicants per hire, time to hire, 90-day retention, and cost per hire by channel, reviewed quarterly at minimum. Without that cadence, budget tends to drift toward whichever channel is loudest rather than whichever channel performs best.
What Does Cost Per Hire and Recruiter Productivity Look Like?
Cost per hire combines internal costs (recruiter salary allocation, ATS licensing, internal referral bonuses) with external costs (job board spend, agency fees, assessment tools). The split matters because internal costs scale with headcount while external costs scale with role difficulty.
- Cost per hire for standard professional roles typically runs lower than for specialized technical or executive searches, where agency fees and extended search time push totals up considerably.
- Open requisitions per recruiter commonly range from 15 to 25 at any given time, with anything above 30 signaling a capacity problem.
- Hires per recruiter per month typically land between 2 and 4, with high-performing teams supported by strong tooling reaching 5 or more.
Three levers move these numbers reliably: scheduling automation (cutting days out of interview coordination), structured referral programs (lowering cost per hire while improving retention), and disciplined interview design (fewer, better-calibrated interview stages instead of six loosely structured rounds).
Pro Tip: If open requisitions per recruiter climbs past 30 for more than a quarter, treat it as a staffing problem before it becomes a quality problem. Overloaded recruiters cut corners on sourcing and screening first.
How Do You Set Realistic Recruiting Benchmarks and Targets?
Setting a defensible target takes more than picking a number from a vendor report and asking your team to hit it. Use this sequence:
- Define cohorts by role level, function, and geography before pulling a single number. Blended averages across a 500-person company hide more than they reveal.
- Collect a 90-day internal baseline for each core metric, segmented by cohort, before setting any target.
- Select comparison data from peer benchmarking sources or standardized reports rather than anecdotal competitor claims. APQC's Open Standards Benchmarking offers standardized cycle-time and hires-per-FTE measures built specifically for cross-company comparison.
- Set two targets per metric: a realistic near-term improvement and a top-quartile stretch goal, reviewed on separate timelines.
Small sample sizes distort comparisons fast. A cohort with fewer than 20 hires per year needs wider benchmark bands or a peer data source rather than a single internal quarter treated as gospel. Reporting cadence should run monthly for operational metrics and quarterly for retention and quality measures, with consistent metric definitions and archive discipline enforced across every requisition. For a deeper look at how cycle-time measurement works from requisition to offer, Segmento do Trabalho's breakdown of the hiring process offers useful comparative grounding.
Why Peer Benchmarking Communities Speed Up Target Validation
Internal data only tells you so much, especially when your sample size for a given role level is thin. Peer benchmarking communities like ESIX, TLIX, and IXCommunities give talent leaders access to anonymized data slices from comparable organizations, moderated benchmarking sessions, and cohort-specific playbooks that a solo internal analysis can't replicate.
- Anonymized peer data slices show how your metrics compare against organizations of similar size and industry, not a blended global average.
- Moderated discussions let you ask peers directly how they solved a specific bottleneck, such as slow offer turnaround for senior roles.
- Cohort reports and playbooks translate benchmark gaps into concrete process changes other teams have already tested.
Heads of TA and CHROs get the most value here, particularly when internal sample sizes are too small to trust a single quarter's data. Before joining any community, ask for a sample data slice and a participant profile so you know the cohort you'd actually be compared against.
How Should You Measure Diversity Hiring and Inclusive Recruitment?
Diversity hiring metrics need the same rigor as any other benchmark: consistent definitions, adequate sample sizes, and segmentation by role level rather than a single company-wide figure. The metrics worth tracking include representation at each funnel stage (applicant pool, interview slate, offer, hire), passthrough rate parity across demographic groups, and retention parity between underrepresented hires and the broader employee base.
Representation at the top of the funnel means little if passthrough rates drop unevenly at the interview stage. A common finding across large employers is that applicant pools show reasonable diversity, but interview slates narrow considerably, which points to a screening process worth auditing rather than a sourcing problem alone. Tracking passthrough by demographic group at each stage, not just final hire numbers, surfaces exactly where that narrowing happens.
Retention parity deserves equal weight. A diverse slate that converts to hires but shows a retention gap at 90 days or one year signals an inclusion problem in onboarding or team culture, not a recruiting problem. Pair retention data with structured exit interviews and stay interviews to catch this early.
Benchmarking diversity metrics against external cohorts requires care, since legal restrictions on collecting and reporting demographic data vary by jurisdiction and role type. Set internal targets based on your own applicant pool composition and funnel data first, and treat external comparisons as directional context rather than a hard target to hit.
What Legal and Compliance Issues Affect Recruiting Metrics?
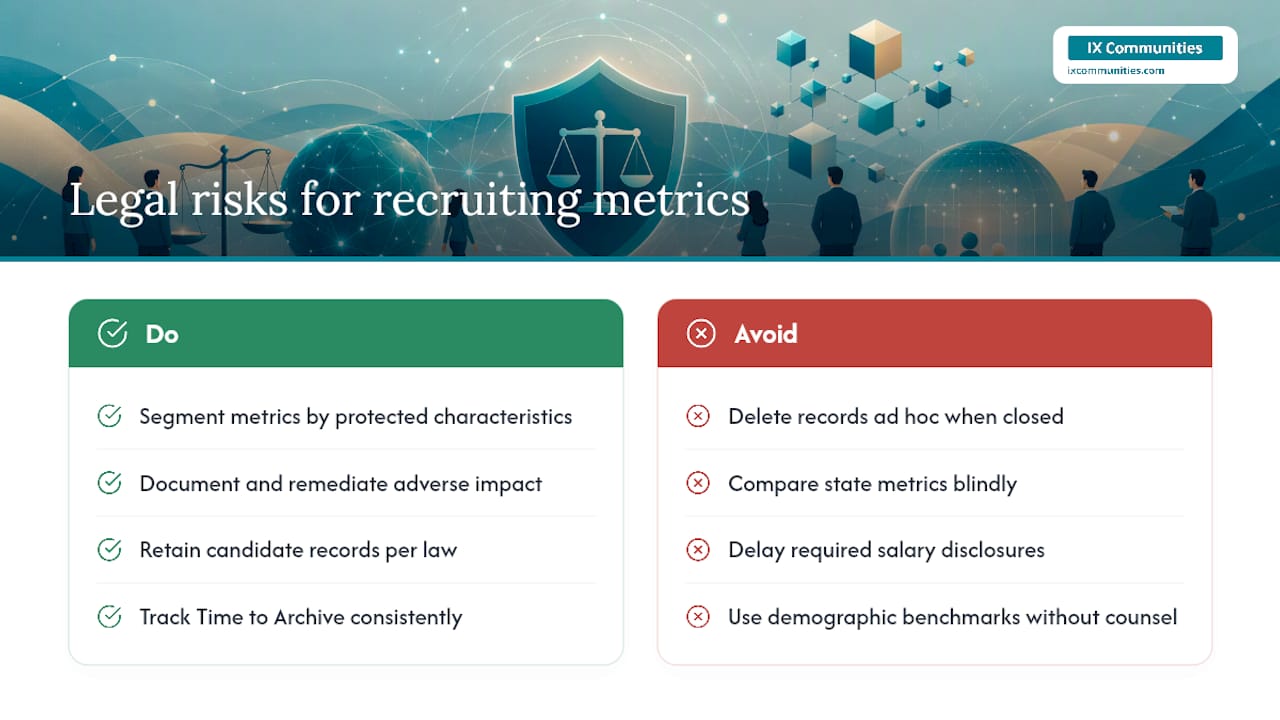
Recruiting metrics sit closer to legal exposure than most talent leaders assume. Time-to-fill and passthrough data, when segmented by protected characteristics, can surface adverse impact patterns that require documentation and remediation under equal employment opportunity frameworks in the United States. The Uniform Guidelines on Employee Selection Procedures set the general framework recruiting teams should be familiar with when analyzing selection-rate disparities across demographic groups.
Data retention policies matter just as much as collection practices. Candidate records, interview notes, and rejection reasons need to be retained for the periods required by applicable federal and state recordkeeping rules, and archived consistently rather than deleted ad hoc when a requisition closes. This is another reason Time to Archive deserves attention as an operational metric, since requisitions left open indefinitely create ambiguity about which records fall under active retention rules.
Pay transparency and salary history laws, now active in a growing number of states, also intersect with recruiting metrics like offer acceptance rate and time to offer. Delayed compensation conversations tend to correlate with lower offer acceptance and longer time-to-hire figures in jurisdictions where salary ranges must be disclosed upfront. Any benchmarking effort that compares metrics across state lines should account for these structural differences rather than treating a lower acceptance rate in one region as a performance problem.
Consult legal counsel before using demographic benchmarking data for anything beyond internal process improvement, particularly when comparisons could be interpreted as informing selection decisions.
How Do Recruiting Metrics Connect to Broader Business KPIs?
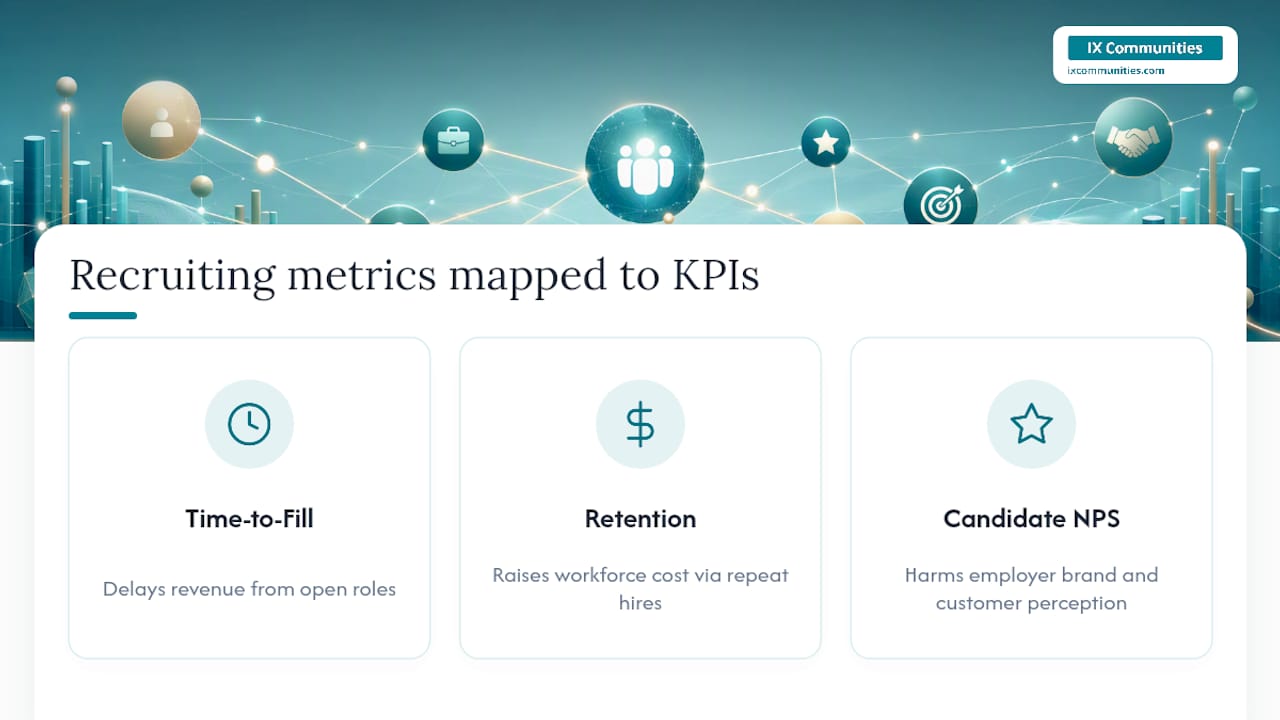
Recruiting metrics only earn a seat at the executive table when they connect visibly to business outcomes the rest of the leadership team already tracks. Time to fill ties directly to revenue: an unfilled sales territory or an open engineering seat has a quantifiable cost in delayed output, and framing time-to-fill delays in those terms gets more traction than presenting the metric alone.
Quality of hire and retention link to workforce planning and labor cost forecasting. A team with high 1-year attrition doesn't just face a recruiting problem, it faces a repeated cost cycle that shows up in finance's headcount budget and in operational disruption for the hiring manager's team. Framing retention benchmarks alongside cost-per-hire data makes the business case for investing in better screening or onboarding far more concrete than either metric presented alone.
Candidate experience metrics, particularly candidate NPS, increasingly connect to employer brand and, downstream, to customer perception in industries where candidates and customers overlap. A retail or hospitality brand with a poor candidate experience is often bleeding the same reputation in its consumer-facing reviews.
The practical move is to build a single recruiting dashboard that maps each core metric to the business KPI it influences most: time to fill to revenue timing, retention to workforce cost, and candidate experience to employer brand. That mapping is what turns a recruiting report into a business conversation.
How Is Automation Changing Recruiting Benchmark Standards?
Recruiting technology has shifted what "good" looks like across nearly every metric in this article, and the shift is accelerating heading into 2026. Organizations using AI in their hiring workflow hire roughly 26% faster than the global median, which means benchmark ranges built on pre-automation data now understate what top-quartile performance actually looks like.
Scheduling automation offers the clearest example. Confirming interviews automatically runs about 26% faster than manual coordination, and because scheduling delays compound across every stage of a multi-round interview process, that single fix often produces the largest visible improvement in overall time to hire.
Application volume has grown sharply as AI-assisted job searching makes it easier for candidates to apply broadly, and Greenhouse's analysis of 640 million applications shows recruiter workload rising in step with that volume. This changes how you should read applicants-per-hire benchmarks going forward: a rising number doesn't automatically mean weaker sourcing, it may reflect a market-wide volume shift that requires better screening automation to manage, not more recruiter hours.
The practical implication for benchmarking is straightforward. When comparing your metrics against external reports, check whether that report's sample reflects organizations using similar levels of automation. A team running manual scheduling and manual resume screening should not expect to hit benchmarks built from a sample skewed toward highly automated recruiting functions.
What TA Leaders Consistently Get Wrong About Benchmarking
The biggest mistake in recruiting benchmarking isn't picking the wrong metric, it's comparing the right metric against the wrong cohort. A company-wide time-to-fill average tells you almost nothing useful, because it buries the 15-day admin hire inside the same number as the 70-day engineering leadership search.
Process discipline matters more than most leaders want to admit. Measurement rigor, consistent metric definitions, and archive discipline sound unglamorous next to headline numbers like cost per hire, but they're what makes any benchmark trustworthy in the first place. Source quality deserves the same scrutiny: a source scorecard reviewed once a year is functionally useless, since budget decisions get made quarterly whether the data supports them or not.
This guide leans on external benchmark reports because they're the most defensible public data available, but internal case studies and longitudinal cohort tracking will always beat a vendor's blended average for decision-making. The honest gap in most benchmarking efforts isn't a missing metric, it's a missing habit of continuous comparison. Peer validation, done regularly rather than once a year during budget season, catches drift before it becomes a crisis.
— Simon
Get Peer-Validated Benchmarks Through Ixcommunities
Vendor reports give you industry averages. Ixcommunities gives you a peer group: anonymized data slices, moderated benchmarking sessions, and cohort playbooks built specifically for corporate talent acquisition and recruiting leaders comparing notes with organizations their own size.

Membership through peer networking communities connects Heads of Talent Acquisition, Chief People Officers, and Chief Talent Officers at mid-to-large companies with peers running the same benchmarking exercise, in a secure environment built for exactly that comparison. Instead of waiting for next year's vendor report to validate a target, members pull anonymized peer slices, join moderated sessions on specific bottlenecks like offer turnaround or source mix, and walk away with playbooks other teams have already tested. That combination of speed and specificity is hard to replicate with a public benchmark report alone. If your internal sample size is too thin to trust this quarter's numbers, visit Ixcommunities to see what a membership includes and how to request a sample data slice before you commit.
Where to Find Authoritative Recruiting Benchmark Data
A handful of reports anchor most credible recruiting benchmarking work right now:
- Greenhouse's Hire Standard draws on 640 million applications across 6,000 companies, useful for application-volume and workload trends.
- SHRM's benchmarking report offers executive-level retention and offer-acceptance data suited to leadership reporting.
- APQC's Open Standards Benchmarking provides standardized cycle-time measures for fair cross-company comparison.
- SmartRecruiters' benchmarking report tracks time-to-hire and AI adoption impact across industries.
- Ashby's Recruiting Operations Benchmarks details scheduling efficiency and source-level passthrough data.
Sources
- Recruiting Benchmarks 2025-2026 Report FINAL
- Hiring benchmarks 2026: Recruiting metrics and trends | Greenhouse
- Talent Acquisition Key Benchmarks: Services Industry | APQC
- Recruiting Operations Benchmarks | Talent Trends Report | Ashby
- 2025 recruiting benchmarking report | SHRM
FAQ
What Are the 5 C's of Recruitment?
Definitions vary across sources, but a common version covers candidate experience, cost, communication, culture fit, and consistency in process. There's no single standardized framework the way there is for benchmarking metrics like time to hire or cost per hire.
What Is the 70/30 Rule in Hiring?
The 70/30 rule generally refers to weighting hiring decisions roughly 70% on skills and experience and 30% on culture or team fit, though the exact split varies by organization and role. It's an informal guideline rather than a benchmark backed by standardized industry data.
What Are Some Common Metrics Used for Benchmarking?
The most common recruiting benchmarking metrics are time to fill, time to hire, offer acceptance rate, cost per hire, funnel passthrough rates, and 90-day and 1-year retention. Peer communities help validate these against comparable cohorts rather than blended industry averages.
What Is the 80/20 Rule in Recruiting?
The 80/20 rule in recruiting typically suggests that 80% of your quality hires come from 20% of your sourcing channels, most often referrals and direct sourcing. Building a source scorecard is the most reliable way to confirm whether that pattern holds true inside your own funnel.