

The global ATS market sits in a wide but sourced range, from roughly $2.65 billion to $17.22 billion depending on how a research firm defines the category, with Fortune Business Insights and Mordor Intelligence anchoring the two ends.
TL;DR:
- The overall ATS market size in 2025 is estimated between $17.22 billion and $2.65 billion, depending on whether adjacent HR tools are included in the definition.
- Vendor market presence highly depends on company size, industry, and whether the ATS is integrated into broader HR suites or built internally.
- AI-driven agentic capabilities and skills-based matching are the key trends defining ATS competitiveness in 2026, moving toward autonomous candidate management.
- Market data is most reliable when triangulated from portal-verified application flows, vendor reports, and peer benchmarking, with verification best conducted via live demo scenarios.
Table of Contents
- ATS Market Size and Forecast for 2026
- Which ATS Vendors Lead Market Share in 2026?
- Market Fragmentation: Concentration Versus the Long Tail
- Adoption Patterns by Company Size and Industry
- Key Trends Reshaping ATS Competitiveness in 2026
- How Reliable Is the Market Data? Methodology and Limitations
- Turning Market-Share Data Into a Procurement Decision
- How Peer Benchmarking Adds Context to Market-Share Numbers
- A Talent Leader's Take on the 2026 ATS Numbers
- Move From Data to Decision Faster
- Sources
- FAQ
ATS Market Size and Forecast for 2026
Two of the most cited research firms disagree on ATS market size by a factor of six, and both are right within their own scope. Fortune Business Insights puts the global applicant tracking system market at $17.22 billion in 2025, with growth continuing through 2034. Mordor Intelligence sizes the market closer to $2.65 billion for 2026, projecting a compound annual growth rate near 7.25% through 2031.
The gap comes down to definition, not disagreement over facts. A market-size estimate that bundles in adjacent HR technology, full HRIS suites, and recruitment marketing tools will land much higher than one that isolates stand-alone applicant tracking functionality. This is exactly why market-size estimates diverge so widely across research houses: some count Workday's entire HCM suite as ATS revenue, while others count only the recruiting module.
A few forces push the market toward the higher end of published forecasts:
- AI feature adoption is pulling budget from adjacent categories (sourcing tools, chatbot vendors) into consolidated ATS platforms that now bundle those capabilities natively.
- Cloud migration among small and midsize employers continues to expand the addressable market beyond the enterprise segment that dominated a decade ago.
- Compliance and skills-based hiring mandates are pushing companies to replace legacy on-premise systems that cannot support structured skills data.
Forces that pull toward the lower end include stricter market definitions that exclude HRIS and payroll bundling, and slower-than-expected SMB adoption in cost-sensitive sectors like retail and hospitality. For a talent acquisition leader building a business case, the honest answer is: cite the range, not a single number, and be explicit about which segment your organizations spend actually falls into.
Which ATS Vendors Lead Market Share in 2026?
The most useful vendor-share number in 2026 doesn't come from a vendor's own investor materials. It comes from a portal-verified audit that checked live careers-page apply URLs across a sample of large employers. ResumeAI's State of ATS 2026 audit verified 704 to 707 employers by confirming which ATS platform actually powered each company's live application flow, rather than relying on self-reported vendor claims or survey responses.
That verification method matters. Vendors routinely inflate install-base numbers by counting expired contracts, dormant accounts, or trial sign-ups. Checking the actual apply-URL host on a live careers page strips that noise out and gives a snapshot of which system is genuinely processing candidates right now.
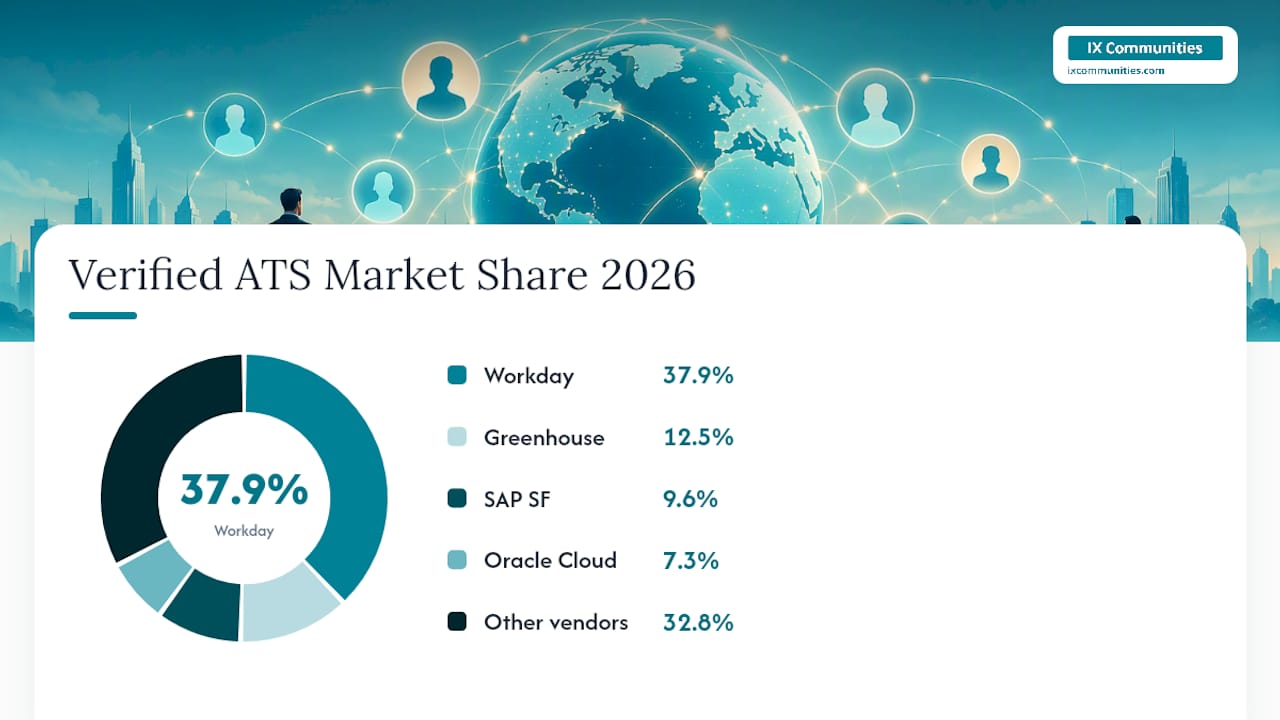
Here's how the verified sample breaks down, cross-checked against the parallel State of ATS 2026 dataset published alongside it:
| Vendor | Verified Share | Notes |
|---|---|---|
| Workday | ~37.9% | Dominant among Fortune 500 and large enterprise employers |
| Greenhouse | ~12.5% | Strong in tech and venture-backed mid-market |
| SAP SuccessFactors | ~9.6% | Common in multinational manufacturing and industrial firms |
| Oracle Cloud HCM | near 7.25% | Concentrated in existing Oracle ERP customers |
| iCIMS | Long-tail share | Present across healthcare and retail enterprise accounts |
| Avature | Long-tail share | Common in executive search and CRM-style sourcing use cases |
| Eightfold | Long-tail share | Positioned around AI-driven skills matching, not volume hiring |
| SmartRecruiters | Long-tail share | Popular with mid-market companies moving off legacy systems |
| Taleo | Long-tail share, declining | Legacy Oracle product losing ground to Oracle Cloud HCM |
| Ashby | Long-tail share, growing | Gaining traction with high-growth tech companies |
| Internal/proprietary | Present but uncounted in vendor totals | Built in-house by a subset of large global employers |
Greenhouse and SAP SuccessFactors bring the top three to approximately 60% combined, according to both the ResumeAI audit and the GitHub-hosted dataset tracking the same verified employer set.
What's easy to miss is the other number in that dataset: 36 distinct platforms appeared across the verified sample. That's not a market with three winners and nothing else. It's a market with three big winners and a genuinely deep bench of viable alternatives, which matters enormously if your company's hiring volume, industry, or geography doesn't match the profile of a typical Fortune 500 account.
Market Fragmentation: Concentration Versus the Long Tail
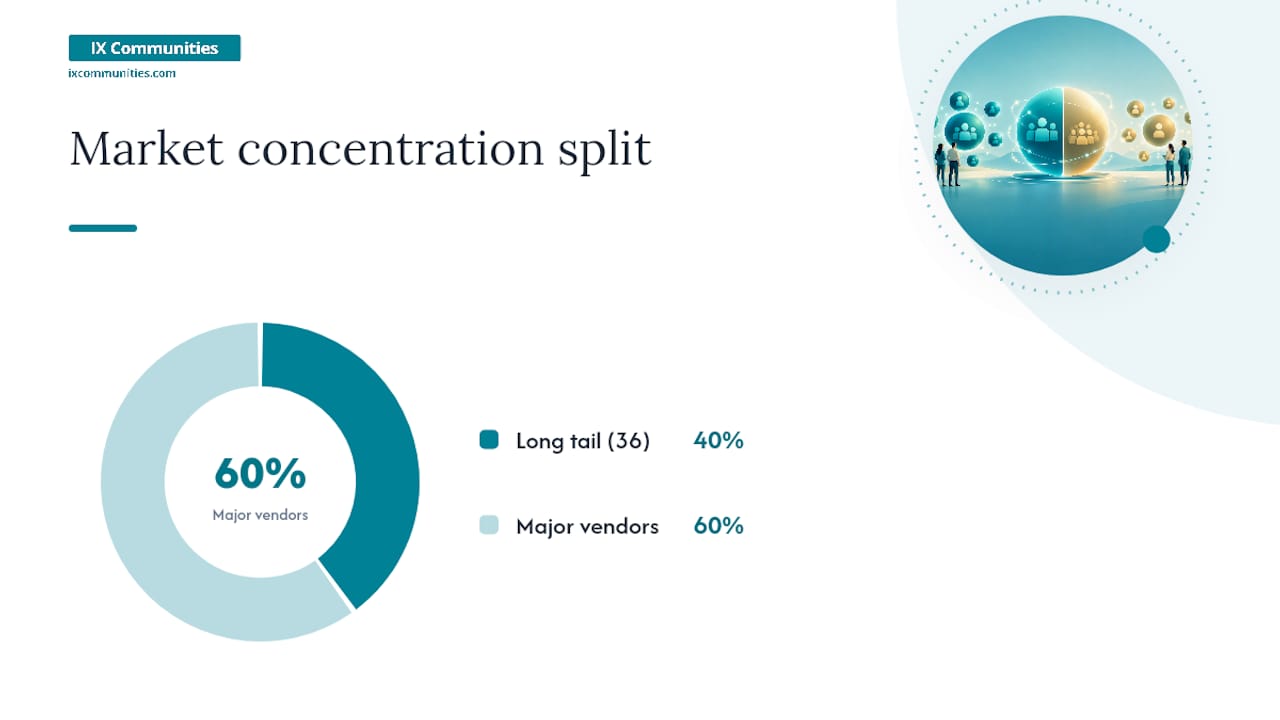
It isn't quite that simple. Thirty-six distinct platforms show up in the verified dataset, which means the remaining 40% of the market is spread thin rather than parked with a fourth or fifth major player.
Segment leadership explains a lot of this spread:
- Enterprise ERP-linked vendors (Workday, SAP SuccessFactors, Oracle Cloud HCM) dominate among companies that already run those vendors' finance or HR systems, since the ATS often comes bundled into a broader platform decision.
- Mid-market specialists (Greenhouse, SmartRecruiters, Ashby) lead among companies that chose their ATS on its own merits rather than as part of a larger enterprise software contract.
- Staffing and high-volume platforms operate almost as a separate market entirely, optimized for throughput and requisition speed rather than the structured workflows enterprise buyers expect.
One factor the verified vendor-share numbers can't fully capture: proprietary, internally built systems. Large global employers sometimes maintain custom-built applicant tracking infrastructure designed around specific compliance, scale, or integration requirements that off-the-shelf platforms don't meet. These systems don't appear in any vendor's install-base claim, and they quietly shrink the addressable market for every commercial ATS vendor competing for enterprise accounts. Press coverage tracking Workday's adoption among Fortune 500 companies confirms the enterprise concentration, but even that leadership position coexists with a meaningful slice of large employers running something built entirely in-house.
Adoption Patterns by Company Size and Industry
Enterprise dominance in revenue doesn't mean enterprise dominance in user counts. Staffing and recruiting agencies, many of them small, generate a disproportionate share of total ATS transaction volume even though their individual contract values are a fraction of a Workday enterprise deal.
- Staffing agencies frequently process far more requisitions per seat than corporate TA teams, and Bullhorn's 2026 usage data shows 78% of high-growth staffing firms now have AI embedded directly into their ATS workflow.
- Enterprise employers (those with thousands of employees, tracked in BLS establishment data) tend to run longer implementation cycles, often six to twelve months, but extract more per-seat value from integrated modules like onboarding and analytics.
- Cloud-hosted deployments now represent the overwhelming default for new implementations in 2026, with on-premise systems largely confined to companies with unusual data residency or security requirements.
The practical takeaway: if you're benchmarking against "the market," specify whether you mean staffing-volume market share or enterprise-contract-value market share. They point to different vendors.
Key Trends Reshaping ATS Competitiveness in 2026
The single biggest shift in the ATS category this year isn't a pricing change or a new module. It's the move from automation to autonomy. Deloitte's 2026 talent acquisition technology research identifies agentic AI as the defining capability separating platforms that merely automate tasks from platforms that manage entire candidate pipelines with minimal human intervention.
That distinction plays out in a few concrete ways:
- Agentic AI now handles sourcing, initial screening, interview scheduling, and even ATS record updates, with human recruiters stepping in at defined decision points rather than every stage.
- Skills-based semantic matching is replacing keyword-filter search, meaning platforms that still rank candidates by exact keyword overlap are losing ground to systems that understand adjacent and transferable skills.
- Omnichannel candidate engagement (SMS, chat, email, and voice unified in one thread) has become a baseline expectation rather than a premium feature.
- Real-time analytics and fraud detection are increasingly built into core ATS workflows rather than sold as bolt-on add-ons, particularly as AI-generated resumes and deepfake interview candidates become a real operational risk.
Analyst coverage from Gartner's 2025–2026 research corroborates this shift, noting that enterprise HR leaders are prioritizing AI capability in vendor evaluations at a higher rate than in prior cycles.
Pro Tip: Don't take a vendor's AI demo at face value. Ask them to run a live, end-to-end scenario in front of you, sourcing a candidate through scheduling an interview, not three separate isolated feature demos stitched together in a slide deck. Isolated demos hide integration gaps that only surface after you've signed the contract.
How Reliable Is the Market Data? Methodology and Limitations
Portal-verified data earns its credibility from what it actually measures: a live check of which vendor's platform is processing applications on a company's real careers page right now. That's different from a vendor's self-reported install base, which tends to include lapsed contracts and unused licenses, and different from a survey, which depends on whoever happens to respond.
Each method has a place, and each has blind spots worth knowing before you cite a number in a board deck:
- Portal-verified audits are strong on accuracy for the specific sample checked but limited to companies with public, crawlable careers pages, which can underrepresent government agencies and highly regulated industries.
- Vendor-reported install-base figures capture contract counts but rarely distinguish active usage from dormant licenses, inflating apparent share.
- Analyst survey methods (the kind behind most CAGR forecasts) capture buyer intent and spending trends well, but sample sizes and respondent pools vary firm to firm, which is part of why Fortune Business Insights and Mordor Intelligence land on such different totals.
The practical fix is to triangulate. Use portal-verified data for "who's actually running what," vendor-reported figures for rough scale context only, and analyst forecasts for budget planning, never treating any single source as the complete picture.
Turning Market-Share Data Into a Procurement Decision
Market-share numbers are only useful if they change what you do next. Here's the order of operations that turns a vendor-share table into an actual decision:
- Weight market share by relevance, not size. A vendor with 5% overall share might have 40% share in your specific industry or company-size bracket, which matters more than its global ranking.
- Ask direct procurement questions. Push every finalist vendor on AI embedment depth, data portability terms, integration breadth with your existing HR stack, and total migration cost and timeline.
- Verify claims before you demo. Check the vendor's actual customer list against companies similar to yours, not just their published logos page.
- Run a data-driven demo. Insist on the live, multi-stage scenario described above rather than a curated feature tour.
- Complete reference checks with peer organizations, ideally companies at a similar headcount and industry, before signing.
- Pilot before full rollout, even when the contract pressure pushes you toward a faster commitment.
A glowing reference from a 200-person startup tells you very little about how a platform performs at 5,000 employees.*
How Peer Benchmarking Adds Context to Market-Share Numbers
Market-share tables tell you what other companies chose. They don't tell you why it worked, or what broke six months into implementation. That gap is where structured peer benchmarking earns its place alongside a vendor-share audit, giving talent acquisition leaders a confidential channel to compare notes with peers who have already run the exact procurement decision under discussion.
A Talent Leader's Take on the 2026 ATS Numbers
Prioritize agentic AI embedment over raw vendor size when you shortlist. Benchmark internally against peers at your scale first, then run a targeted pilot with two finalists before committing.
— Simon
Move From Data to Decision Faster
Reading a vendor-share table is one thing. Knowing whether Workday's dominance actually fits a company your size, in your industry, is another problem entirely, and that's where a peer network solves what a market report can't. A peer community gives talent acquisition and executive recruiting leaders a vendor-free space to compare real procurement experiences with peers who have already run the exact ATS evaluation you're facing, without a sales team in the room.
Membership through TLIX connects talent acquisition leaders directly with peers who have already tested and implemented the platforms covered in this article. If your evaluation is more about executive search infrastructure, ESIX membership focuses that same peer benchmarking on senior-level recruiting workflows, and DSIX membership applies it to diversity recruiting strategy specifically. Teams that need their recruiters trained on new ATS workflows quickly can also use Ixcommunities' on-demand and live recruiter training courses, starting at $350 for on-demand access or $750 for live online sessions. Visit the membership page to see how the ExecSmart database and member resources fit into your next vendor evaluation.
Sources
The ResumeAI portal-verified audit and its companion GitHub dataset give the clearest citable vendor-share snapshot available. Fortune Business Insights and Mordor Intelligence provide the two most-cited market-size forecasts. Deloitte's 2026 trends report and Bullhorn's usage data round out the trend and adoption picture. For broader platform-comparison context, see this HR software comparison for e-commerce employers.
- ATS Market Share Statistics 2026 — Portal-Verified Numbers | ResumeAI
- Applicant Tracking System Market Size, Industry Report 2034
- Applicant Tracking System Market Size & Share Analysis
FAQ
What Are the Top ATS Systems by Market Share?
Workday leads with roughly 37.9% verified share among large employers, followed by Greenhouse at approximately 12.5% and SAP SuccessFactors at around 9.6%. Oracle Cloud HCM, iCIMS, Avature, Eightfold, SmartRecruiters, Taleo, and Ashby make up much of the remaining long tail, alongside internal proprietary systems at some large employers.
How Many Companies Actually Use an ATS?
Nearly all mid-to-large employers use some form of applicant tracking system today, and the BLS establishment data shows the scale of the potential buyer base across US employers of varying sizes. Adoption is close to universal at the enterprise level, with smaller companies and staffing agencies representing the fastest-growing adoption segment in 2026.
Which ATS Is Considered the Most Popular?
Workday is the most widely used platform among large, established employers, holding the top verified share in the 2026 portal-verified audit. Popularity varies sharply by company size and industry, so a mid-market tech company is more likely to encounter Greenhouse or Ashby as the dominant choice in its peer set.
Can an ATS Hurt My Chances of Getting Hired?
An ATS itself doesn't reject qualified candidates, but poor resume formatting or missing keywords relevant to the role can cause a strong application to rank lower in a recruiter's queue. Skills-based semantic matching is reducing this risk in 2026 as more platforms move away from strict keyword filtering, but formatting and clarity still matter.
How Do I Choose the Right ATS for My Company in 2026?
Start by matching vendor strengths to your company size and industry rather than defaulting to the largest overall market-share leader. Test AI capabilities with live, end-to-end demo scenarios, verify references from peers at a similar scale, and consider peer benchmarking through a group like Ixcommunities' TLIX membership before finalizing a procurement decision.